ppi

Inflation Monitor – January 2016


Inflation Monitor Summary – Composite Ranking

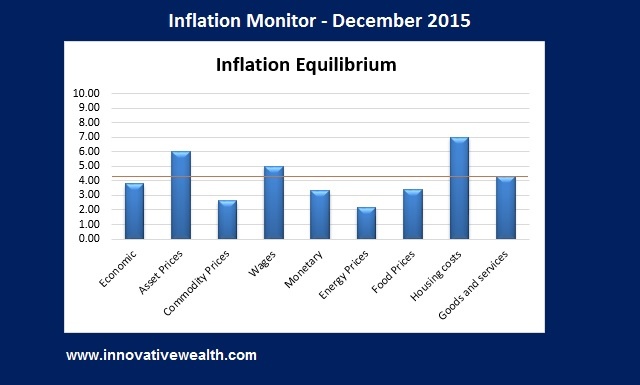
Inflation Monitor Summary December 2015

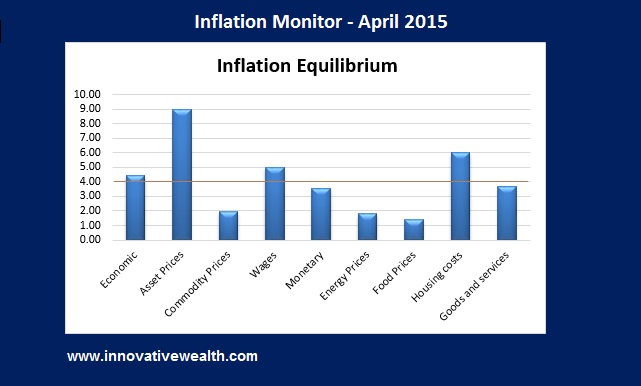
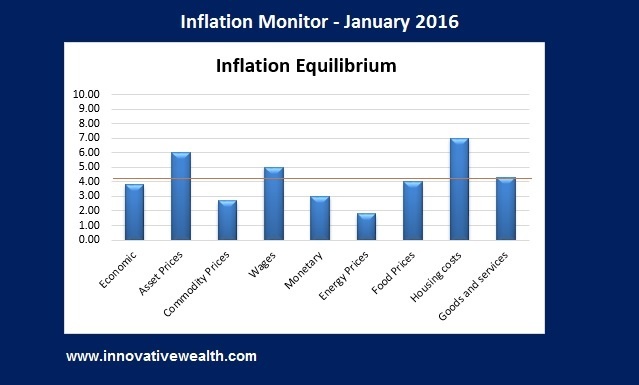
* The Inflation Equilibrium is a quick summary for the whole data series of the inflation monitor. If you don’t like statistics, this is the chart for you.


Inflation Monitor – January 2016 – Introduction


Happy New Year. I hope you enjoyed your holidays with lots of eggnog and holiday cheer.

2016 has started with a bang… or rather a thud. The US equity markets have had their worst start to the new year ever. I guess you could say that the thud has not happened yet since the US stock markets are still falling. The Chinese stock markets have gotten all the blame, but I think the drop in equities is overdue.

In week one, S&P 500 (-6%), NASDAQ (-7.3%), and Dow (-6.2%). Gold surprised to the upside +3.1%.

End of week two, S&P 500 (-8%), NASDAQ (-10.4%), and Dow (-8.2%). Gold is still up 1.8%.

If you have been following this Inflation Monitor for the past year you will know my thoughts on the markets. We saw strong deflationary data last year. Not surprisingly, no one noticed. The fact that it took the equity markets this long to react to this data is really the only surprise I see.

If you have not read my 2015 recap, then now is a good time to read it. Last year the S&P 500 ended with a performance of -0.7%, which is surprising since many blue chip companies were down between -10% & -20% for the year. If you did nothing but look at the index, you would have missed the large dislocation of the index performance and the performance of the underlying stocks.

The risk you should consider this year is contagion. This is the risk of assets selling off because other assets are selling off, having very little to do with underlying fundamentals. For example, if the high yield bond market continues to sell off or worse yet, crashes, then the investment grade corporate bond market may also sell off. This in turn could lead to a sell off in equities and other assets. The spread of this contagion is not knowable, but you should be aware of this risk.

Read More…

Inflation Monitor – January 2016 Read More »

Inflation Monitor – December 2015


Inflation Monitor Summary – Composite Ranking

Inflation Monitor Summary December 2015


* The Inflation Equilibrium is a quick summary for the whole data series of the inflation monitor. If you don’t like statistics, this is the chart for you.


Inflation Monitor – December 2015 – Introduction

This is the last issue of 2015. I hope you are enjoying the holidays and getting ready to bring in the new year. While this is a joyous time of the year. It should be used to reflect on the past year and what surprises are to come in the next 12 months. While no one can know the future, we can look for signs that things are not quite right. These are what I would call new potential risks to the equilibrium of the global financial markets.

Read More…

Inflation Monitor – December 2015 Read More »

Inflation Monitor – November 2015


Inflation Monitor Summary – Composite Ranking

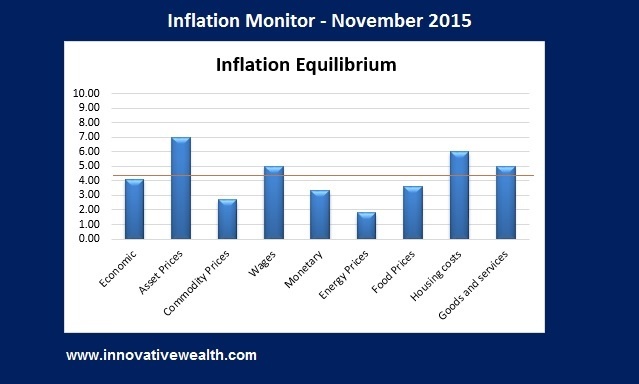
inflation monitor november 2015 summary

* The Inflation Equilibrium is a quick summary for the whole data series of the inflation monitor. If you don’t like statistics, this is the chart for you.


Inflation Monitor – November 2015 – Introduction

Looking at the past year I have to give a hearty laugh at the people to claim that the US Dollar is losing value. I wonder if these people own a computer, or have bothered to look at the US Dollar chart. It is included below along with the chart of gold (which is a long gold/short US Dollar trade) and a few other important  assets.

The important thing to know about the US Dollar is that putting a value to it is complicated because it is a fiat currency. This means there are more than one moving variables that need to be accounted for to determine whether it is rising or falling in value.

Take gold for example. Gold is a chunk of metal. People put a price on it of what they are willing to pay for it, but that is it. Its price is only determined what someone with a specific currency is willing to pay for it. Pricing an asset like gold is easy. Prior to being removed from the gold standard, the US Dollar was pegged to the price of gold, so there was an easy relationship which could be determined.

Now let’s take a look at the current version of the US Dollar in comparison. The US Dollar is a piece of paper, but also a whole lot more.

What is a US Dollar worth?

Read More…

Inflation Monitor – November 2015 Read More »

Inflation Monitor – July 2015

Inflation Monitor Summary – Composite Ranking

Inflation Monitor Equilibrium

* The Inflation Equilibrium is a quick summary for the whole data series of the inflation monitor. If you don’t like statistics, this is the chart for you.


Inflation Monitor – July 2015 – Introduction

I hope you enjoyed your Independence Day. While Greece may not have the same appreciation of our holiday, they had one of their own… A Bank holiday. While the Greek Crisis in Europe seems to be solved??? The greater problem persists. The Greek people voted a resounding “NO” on the terms and the Greek PM moved forward with it anyway. Apparently Greece is happy kicking the can down the road, and I can’t blame them. They can never pay back the debt they owe and they are getting additional loans to pay the interest in the loans they already have. Europe seems to want to keep them in the EU for other reasons, but the end result is that they eventually will have to deal with this. I’m sure the politicians would rather this problem breaks loose on someone else’s watch. Everyone wins by prolonging this and everyone loses eventually by letting this happen.

The US Markets continue to be quiet with no additional QE and a prospective tightening in the near future. The economy continues to be strong, but some signs are cropping up in small amounts showing that caution is warranted. I have added a few charts to this issue that I found interesting this month.

I hope you enjoy this month’s Inflation Monitor – July 2015.

Kirk Chisholm

Read More…

Inflation Monitor – July 2015 Read More »

Inflation Monitor – June 2015

Inflation Monitor Summary – Composite Ranking

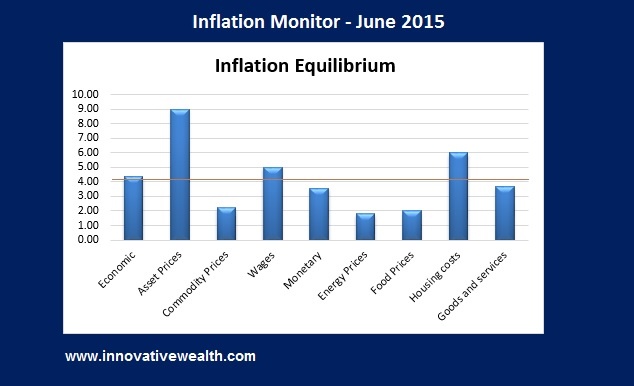
Inflation Monitor Summary


* The Inflation Equilibrium is a quick summary for the whole data series of the inflation monitor. If you don’t like statistics, this is the chart for you.


Inflation Monitor – June 2015 – Introduction

It is officially summer and most markets are becoming more quiet. This is of course excluding the ongoing crisis in Greece. They must love the attention because they have been dragging out this “crisis” since 2011. Everyone involved in this mess (on both sides) has a reason to kick the can down the road forever, but forever will not last that long. Greece has call for a referendum vote from the people. We will find out what the people want next week.

While the US markets have been quite, there have been some disturbing signs cropping up in some of the economic indicators that we follow. These are: the velocity of money, PPI, and market cap to GDP. While many of the numbers listed above show deflation, these three are especially concerning. One interesting and potentially inflationary sign is a sharp pickup of the Baltic dry Index.

Enjoy this month’s Inflation Monitor – June 2015.

Kirk Chisholm

Read More…

Inflation Monitor – June 2015 Read More »

Inflation Monitor – May 2015

Inflation Monitor Summary – Composite Ranking

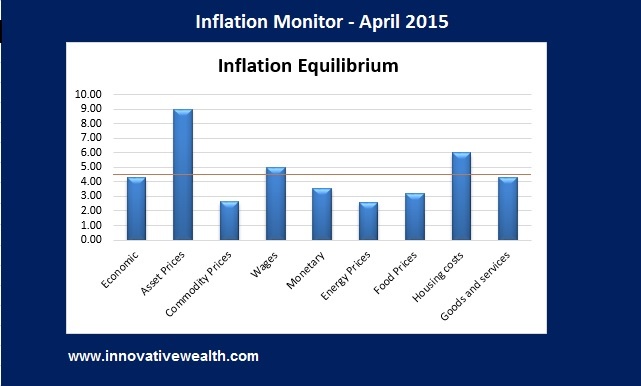
Inflation Monitor Summary

* The Inflation Equilibrium is a quick summary for the whole data series of the inflation monitor. If you don’t like statistics, this is the chart for you.


Inflation Monitor – May 2015 – Introduction


This month we were a bit slow getting this out due to some website upgrades. We expect that this June version of the Inflation Monitor will be out in 2 weeks so you will get a double dose of information.

May was a month of mixed results. Some data is showing some signs of life with inflation, but others show the decline of inflation continues… albeit slowly. Based on my estimates,2 Q3 and Q4 of this year should start to show some signs of economic slowdown. While we have started to see this in the earnings numbers, due to a lot of the hedging done by large public companies, the earnings may be less impressive when those hedges expire.

The quick rise in the US Dollar and lack of QE in the US may be too much for the US economy to handle. It typically takes a few months before these effects filter down into the economy. But I xpect later this year to see the results of those changes. There are many interesting data points to consider, but the PPI is one of the most interesting this month.

Other issues which are concerning…

The effects of debt have been slowly accumulating in the US over time and have put an increasing amount of weight on the growth of the US economy. It is hard to grow out of a recession when a large amount of your revenues go to paying off interest on your debt. Maybe this can put some perspective on the balance sheet of the US.

According to the GAO, the US has net worth of -17.7T, which is higher than the -16.9T last year. If you include the 42T in unfunded liabilities, this brings the total net worth of the US to -60T. That is not small amount of money to pay back. This is a little over $188,000 per person in liabilities. I think it is unlikely that this will get paid back in anything but inflation. What if the US cannot inflate away their debts like other countries have in the past? That will put the US in an interesting position. The available options are not pretty.

While there is constant discussion about how big of a problem this it… and it is, the reality is that this won’t be a problem until it is. By this I mean that the US, as the world’s reserve currency, has a special position in that they cannot default on their debt unless they choose to. Other countries do not have that luxury.

As long as the US Dollar is desirable to the rest of the world, we can continue to play this charade as long as we want. Then one day that will change and we will be in trouble. Until then, party like its 1999.

Enjoy this month’s Inflation Monitor – May 2015.

Read More…

Inflation Monitor – May 2015 Read More »

Scroll to Top