gold

Top 10 Ways That Wealthy Families Protect and Grow Their Wealth


wealth

“Wealth is the ability to fully experience life.”

– Henry David Thoreau

“Wealth” —  can be defined as assets or resources which are in excess of present or future expected expenses. A more simple explanation is that wealth is made up of assets which exceed what will be needed for this generation, and could be passed onto the next one. Even though a family’s assets may not be needed for this generation, proper stewardship is required to make sure those assets will last for future generations.

The main considerations in protecting wealth for future generations are that the assets must be sustainable over several generations, resistant to inflation, and resistant to political and economic turmoil. It is possible to invest in certain assets that can fortify your wealth against some of these external risks. However, there is a much greater risk of future generations not being good stewards of the sustainable wealth. Whether you are the first generation to create generational wealth, or whether you are researching how to sustain the wealth you have inherited, this list will give you some guidance.
 

Read More…

Top 10 Ways That Wealthy Families Protect and Grow Their Wealth Read More »

Inflation Monitor – June 2017

inflation monitor subscription

Inflation Monitor – June 2017 – Introduction

“The equity market continue to float on a cloud of who knows what”. | “This is not like any market anyone alive has seen before.” | “There is no euphoria, which is usually not a sign of a market peak.” | “There is enough pessimism for the market to continue climbing higher.” | “The engine seems to be running, but no one has bothered to look under the hood.” — These are just some of the comments I have heard from portfolio managers in the past month.

This month I want to discuss the topic of value. Value is a term that means different things to different people. Frequently. people use the term to describe investments that are “cheap”. Of course, “cheap” also means different things to different people.

Read More…

Inflation Monitor – June 2017 Read More »

Inflation Monitor – March 2017


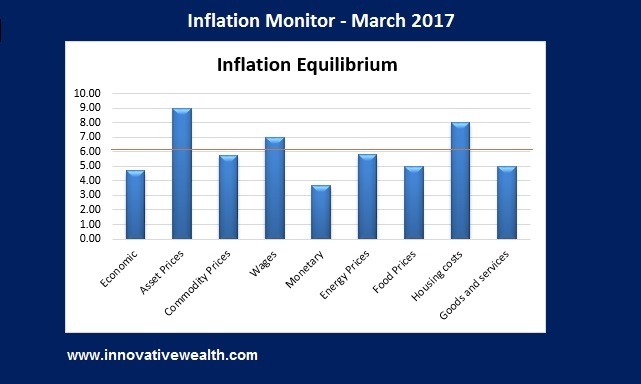
Inflation Monitor Summary – Composite Ranking

Inflation Monitor - March 2017 Summary
 

Inflation Monitor – March 2017 – Introduction


Wow! What a winter we have been having this year. We have had some big changes in recent inflation data. It is a mystery to most people as to why this has taken place, especially with the pre-election slowdown. However, this month we will be discussing a number of things including, a big surprise to earning growth, the mystery of the big jump in inflation, Trump’s potential impact on inflation, and most importantly the biggest change in inflation trends in the past 8 years. You will not want to miss this month’s Inflation Monitor.

Read More…

Inflation Monitor – March 2017 Read More »

Inflation Monitor – December 2016


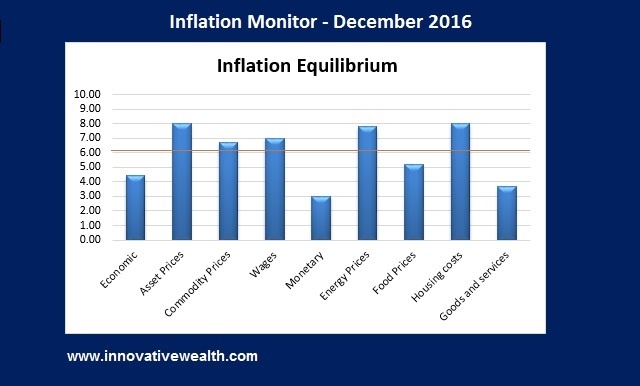
Inflation Monitor Summary – Composite Ranking

Inflation Monitor - December 2016 Summary
 

Inflation Monitor – December 2016 – Introduction


We have a lot to cover this month in the Inflation Monitor – December 2016. This is the end of 2016. It is a time for reflection for the year past and for pontificating the future. We all know no one can predict the future. And so much is up in the air with the recent populous trend changes, let’s focus on last year.

Let’s start with the US presidential elections. Donald Trump will be our next president (#45) in the US. Some people are happy, and others are sad. Regardless, we have a huge potential shift in the US with the results of the presidential election finalized. The first thing to address is that Trump may or may not pursue the same policies he campaigned on. Every presidential candidate has their platform, but not all of the promises actually happen. Let’s put these in the wait and see category up for discussion after his first 100 days. He will have about 100 days to prove his worth and keep the positive (market-related) momentum going.

While I have seen a lot of positive signs since Trump was elected, the US is overdue for a recession. The S&P 500 had a string of 5 quarters in a row of declining earnings. Apparently, no one noticed. I would consider this a recession, but the markets did not. The markets are always right regardless of what I think. It will be interesting to see what happens once the “new president hangover” wears off.

Read More…

Inflation Monitor – December 2016 Read More »

Inflation Monitor – October 2016

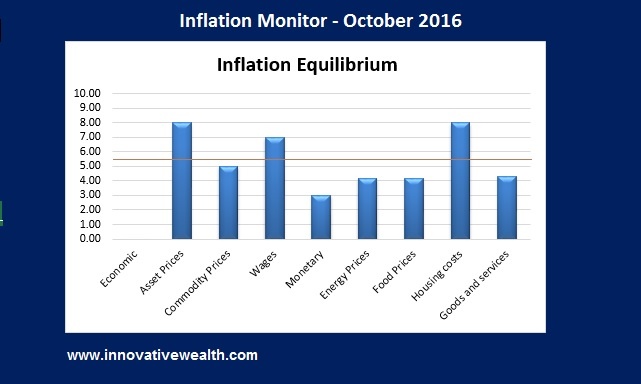
Inflation Monitor Summary – Composite Ranking

Inflation Monitor - October 2016 Summary


Inflation Monitor – October 2016 – Introduction

Happy October! We are in the heat of the presidential election cycle which thankfully will end in early November. We have the two least liked candidates fighting for control over the POTUS position. We have already had three debates… If you could call it that. After watching the first debate… On to brighter topics… Deutsche Bank has been in real trouble lately. The kind of trouble that Bear Stearns, Lehman Brothers, and many other US financial institutions were in in 2008. High leverage, holding bonds of questionable quality, and institutional investors starting to pull their money and run for the doors. If you are familiar with the concept of yelling fire in the theater, a bank run is very similar.

Read More…

Inflation Monitor – October 2016 Read More »

Inflation Monitor – September 2016

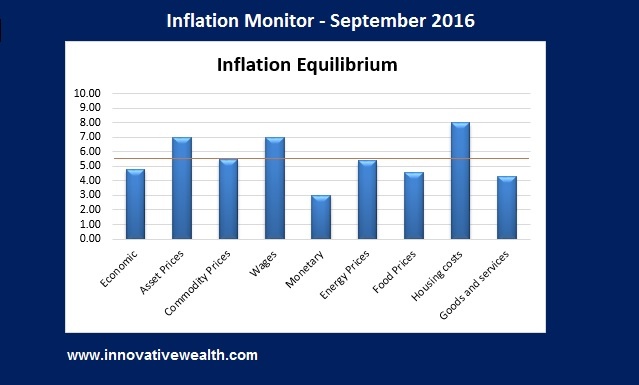
Inflation Monitor Summary – Composite Ranking

Inflation Monitor - september 2016 Summary


Inflation Monitor – September 2016 – Introduction

We are back… After a summer of great weather, we have returned with the September 2016 edition of the Inflation Monitor. I want to apologize to all our readers for not writing an August edition, but if you were paying attention to the global economy in August (and you might be the only one), then you will realize that virtually nothing happened of note. Sure prices changed and economic numbers moved, but if you look at the stock markets, no one noticed and the volume shows that very few people were even working. However, kids are going back to school, Wall Street traders are back from vacation, so should we expect to see more activity? We will soon find out.

If you start to notice the obvious elephant (or donkey) in the room, the US presidential elections are coming up and the ensuing fireworks will most likely be moving the markets. In July, I watched an interesting assessment of the presidential election presented by Larry Lindsey and it provided a few scenarios of outcomes based on certain events happening. While I don’t have the slides, it was truly astounding. I’ll spare you the details except to point out two notable items that I took away from the event….

Read More…

Inflation Monitor – September 2016 Read More »

Inflation Monitor – July 2016

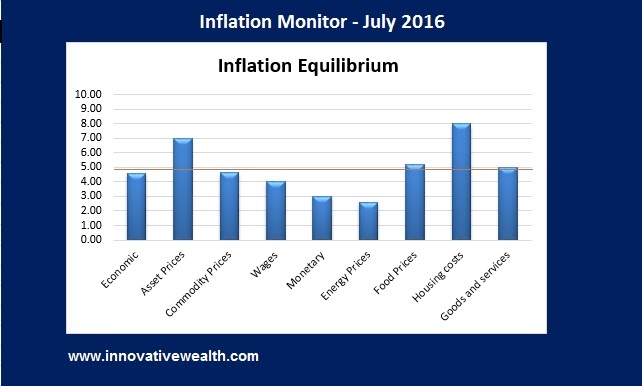
Inflation Monitor Summary – Composite Ranking
Inflation Monitor - June 2016 Summary


* The Inflation Equilibrium is a quick summary of the whole data series of the inflation monitor. If you don’t like statistics, this is the chart for you.


Inflation Monitor – July 2016 – Introduction

“Debt is future consumption brought forward. Once debt is incurred, consumption that might have happened in the future won’t happen, and it should come as absolutely no theoretical surprise that at a certain level of debt, growth and income begin to diminish. That is exactly what we are seeing in the real world, even if those who espouse the reigning economic paradigm (Keynesianism) are still in love with their beautiful theory.”

I hope you had a happy Independence Day. A day that is in remembrance of the US’ independence from Britan. How ironic that only 11 days prior to our independence day, the UK declared its independence from the EU. If you don’t know about the Brexit, you must have been living in the woods for the past month. Everyone has been discussing this monumental vote with varying degrees of opinion as to what it could mean.

I have not wanted to discuss it much prior to the vote, because despite what you hear on TV, no one really knows what will happen. Sure there are plenty of “smart” people who have an opinion about what will happen. Some think the world will end, or we will spiral into WW3, others think it is a great thing for the UK. Let me rain on the parade of all these “smart” people. No one knows what will happen. There are too many variables to count and although there are some very important issues that may come up due to this vote, this has never happened before, so we have no reference point of what could happen.

Many people have some relevant thoughts on the issue, but in terms of what will happen, it is mostly political, so unless you know the minds of all the various politicians involved with the UK, EU, and each individual country, you cannot make a thoughtful prediction as to the outcome.


Here are some of the relevant points you should consider.

Read More…

Inflation Monitor – July 2016 Read More »

Inflation Monitor – June 2016

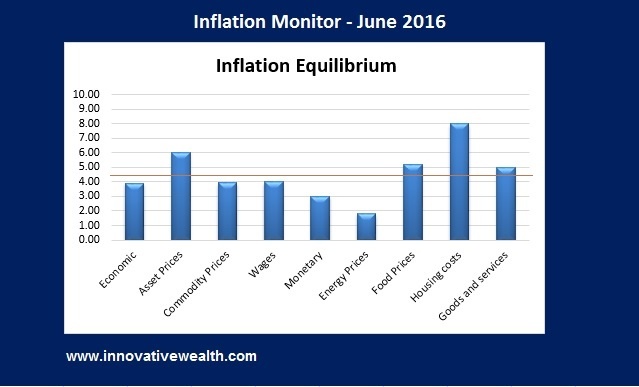
Inflation Monitor Summary – Composite Ranking

Inflation Monitor - June 2016 Summary


* The Inflation Equilibrium is a quick summary of the whole data series of the inflation monitor. If you don’t like statistics, this is the chart for you.


Inflation Monitor – June 2016 – Introduction

If you are older than 30 years old, then you are probably scratching your head about negative interest rates. You have spent most of your life under the assumption that positive inflation is normal. You expect it. You probably treat it as a rule of nature rather than an assumption. Well, you are probably surprised to see negative interest rates around the world. While we have not yet seen them here in the US, it is only a matter of time till we see them here.

We have seen a strong push from the central banks around the world into negative interest rate territory. On June 5, 2014, the ECB introduced its negative interest rate policy (NIRP). On January 29, 2016, Japan introduced their version of NIRP. As of March 2016, the ECB dropped their deposit facility rate to -0.40. They are also started purchasing investment grade euro-denominated corporate debt. On June 14, 2016, Germany’s 10-year bund fell below zero to -0.033%. This is historic because it has never happened before.

As of now Switzerland, Japan, and Germany, all have 10 years sovereign bonds that are yielding negative interest rates. Where will this madness end? In case you didn’t think that was crazy, there’s more.

Read More…

Inflation Monitor – June 2016 Read More »

Inflation Monitor – May 2016

Inflation Monitor Summary – Composite Ranking

Inflation Monitor - May 2016 Summary


* The Inflation Equilibrium is a quick summary for the whole data series of the inflation monitor. If you don’t like statistics, this is the chart for you.


Inflation Monitor – May 2016 – Introduction


This month I want to discuss population growth. This is one of those topics which when you see the word, you probably instantly fell asleep. sorry…

However, this topic is important because it is one of the factors determining inflation. In the US as in many of the developed economies, population is not growing as fast as it needs to in order to sustain the current rate of growth. Currently the US has a population growth rate at below 1% ( 0.77%). Countries like Japan, Russia, China, and eastern Europe have shrinking populations.

Slow to negative population growth economies have a significant deflationary force to overcome. This deflationary force cannot be simply determined by looking at population growth, since it also depends on the age distribution of the workforce and other factors, but it does give you a general sense of which countries have some serious headwinds to overcome if they want growth via inflation.

Read More…

Inflation Monitor – May 2016 Read More »

Inflation Monitor – April 2016

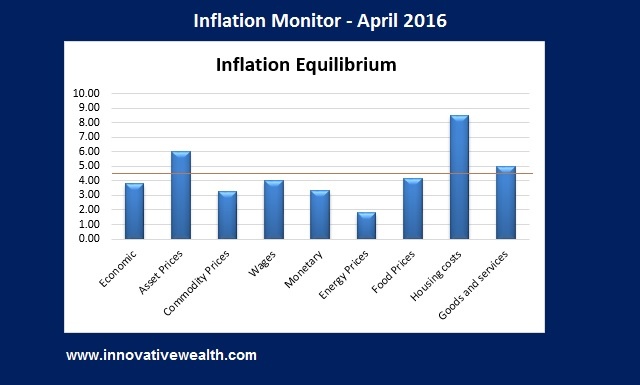
Inflation Monitor Summary – Composite Ranking

Inflation Monitor - April 2016 Summary

* The Inflation Equilibrium is a quick summary for the whole data series of the inflation monitor. If you don’t like statistics, this is the chart for you.


Inflation Monitor – April 2016 – Introduction


April Fool’s… every year people use this day to play practical jokes on others. This year it was the Fed’s turn to make fools of us all. Janet Yellen made a strong point early in her tenure as Fed Chair that she believed in more transparency with communications to the public about Fed policy. She must have a new years resolution this year that we are not aware of, because her transparency has taken a back seat to settling the market gyrations. The Fed has always claimed that their decisions are not driven by the stock market, however their recent actions might suggest otherwise.

Read More…

Inflation Monitor – April 2016 Read More »

Inflation Monitor – March 2016


Inflation Monitor Summary – Composite Ranking

Inflation Monitor - March 2016 Summary


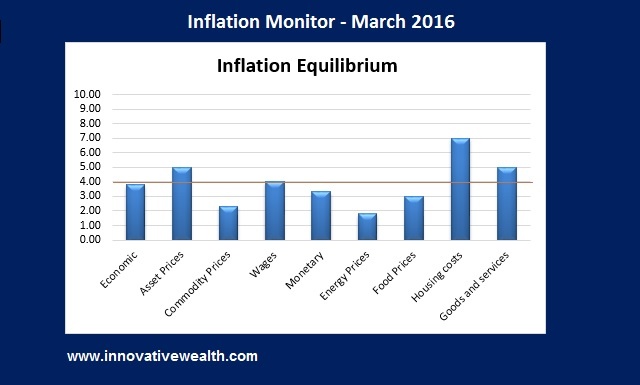
* The Inflation Equilibrium is a quick summary for the whole data series of the inflation monitor. If you don’t like statistics, this is the chart for you.


Inflation Monitor – March 2016 – Introduction


The first quarter of 2016 has been an interesting one. It started off with a significant bout of volatility and risk-off investing. Then after the stock market bottomed in mid-January and re-tested those levels a few weeks later, it has taken off like a rocket. It was almost as if the global economic troubles didn’t exist anymore. Unfortunately they do… It was almost as if someone (the Fed) waved their magic wand and all the problems of the world just disappeared.

Magic is a wonderful thing. Easter is coming soon. Kids are eagerly awaiting the day where they get chocolate eggs and toys from the magical bunny. What a wonderful thing to believe in magic and illusion.

While many of you don’t believe in the Easter bunny, you probably believe in magic. Earlier this year the markets swooned based on poor economic data, then the Fed told a magical story of how they are data dependent (but only when they want to be) and lowered rate hike expectations and without further consideration the market believed it and started to rise.

Spoiler Alert for those of you who still believe in the Easter bunny, he isn’t real, and neither is this stock market rally.

Sure the prices confirm that stocks and commodity prices have been rising in the past few weeks, but what has really changed? Have US or global economic conditions improved? The only thing that has changed significantly in the past 3 months has been the stock market. So does the Fed’s data dependency include stock prices? Maybe I missed that Fed meeting where they discussed how stock prices determined monetary policy.<end sarcasm>

The Fed’s stated target of four interest rate hikes in 2016 communicated to the public that US economic conditions were strong enough to attempt to return to historically normal rates… At least those were the expectations communicated by the Fed.

At the last Fed meeting, Fed Chairwoman and magician Janet Yellen indicated that the number of rate hikes may be closer to only two. Like magic, the markets rose to greet the new bullish expectations. Apparently four rate hikes was too much and two was just the right amount. The Fed has a notoriously poor track record of predicting the future of interest rates and inflation, but in this case there may be another motive.

The Fed has another magic trick in their act other than changing the fed funds rate and printing money. With a few carefully placed words they can change the direction of the stock market. All market participants want to know what the Fed says. They hang of every word uttered by Fed board members. Yet what the Fed actually does is very little. One meeting they predict 4 rate hikes and the next they reduce it to 2. They have not changed any of the underlying conditions, but like magic, they have made everything all right again in the markets.

This is one of the Fed’s greatest tricks…

Read More…

Inflation Monitor – March 2016 Read More »

Inflation Monitor – February 2016


Inflation Monitor Summary – Composite Ranking

Inflation Monitor Summary December 2015
 

Inflation Monitor – February 2016 – Introduction


It is February, and winter has finally arrived in the northeast. Not only has the weather turned cold, but so have the markets. The stock markets started the year off cold with the worst start to January performance on record and ending with the S&P 500 down -3.37% for the month. The start of February has not been great either. As I write this the S&P 500 is at its lowest levels since February 2014.

Generally this Inflation Monitor is not focused on the stock markets, but I have been wondering for the past year how long it would take for the stock market to realize that deflation was strong and growing stronger. Apparently it is now on the table since Japan lowered their interest rates into negative territory to join their European brothers. The idea of negative interest rates should be an episode of the twilight zone. It is new to almost everybody and how this plays out will certainly be interesting. What is the definition of insanity? Doing the same thing over and over and expecting different results. (this was not said by Einstein, although frequently attributed to him).

Gold has finally picked up steam in the past few weeks with the metal up over 10%. Maybe it the fear of negative interest rates that is driving the flight to safety in gold. With the rest of the commodity complex still in a bear market, I doubt gold and silver prices will start a new bull market. Only time will tell, but despite the rise in gold price in US Dollars, it is important to note the price of gold in other currencies (see this below in the gold section).

I mentioned this last month, and I’ll mention it again.

If you have not read my 2015 recap, then now is a good time to read it. Last year the S&P 500 ended with a performance of -0.7%, which is surprising since many blue chip companies were down between -10% & -20% for the year. If you did nothing but look at the index, you would have missed the large dislocation of the index performance and the performance of the underlying stocks.

The risk you should consider this year is contagion. This is the risk of assets selling off because other assets are selling off, having very little to do with underlying fundamentals. For example, if the high yield bond market continues to sell off or worse yet, crashes, then the investment grade corporate bond market may also sell off. This in turn could lead to a sell off in equities and other assets. The spread of this contagion is not knowable, but you should be aware of this risk.

 
Read More…

Inflation Monitor – February 2016 Read More »

Inflation Monitor – January 2016


Inflation Monitor Summary – Composite Ranking

Inflation Monitor Summary December 2015

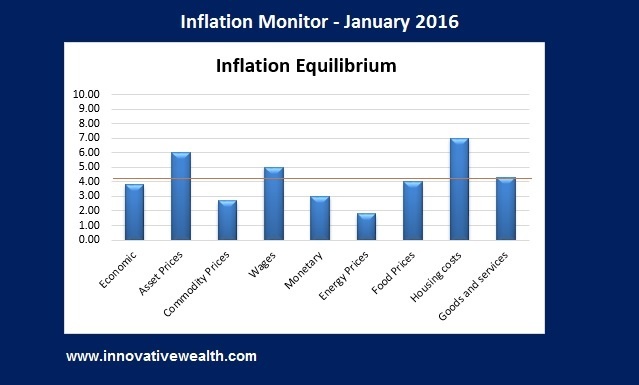
* The Inflation Equilibrium is a quick summary for the whole data series of the inflation monitor. If you don’t like statistics, this is the chart for you.


Inflation Monitor – January 2016 – Introduction


Happy New Year. I hope you enjoyed your holidays with lots of eggnog and holiday cheer.

2016 has started with a bang… or rather a thud. The US equity markets have had their worst start to the new year ever. I guess you could say that the thud has not happened yet since the US stock markets are still falling. The Chinese stock markets have gotten all the blame, but I think the drop in equities is overdue.

In week one, S&P 500 (-6%), NASDAQ (-7.3%), and Dow (-6.2%). Gold surprised to the upside +3.1%.

End of week two, S&P 500 (-8%), NASDAQ (-10.4%), and Dow (-8.2%). Gold is still up 1.8%.

If you have been following this Inflation Monitor for the past year you will know my thoughts on the markets. We saw strong deflationary data last year. Not surprisingly, no one noticed. The fact that it took the equity markets this long to react to this data is really the only surprise I see.

If you have not read my 2015 recap, then now is a good time to read it. Last year the S&P 500 ended with a performance of -0.7%, which is surprising since many blue chip companies were down between -10% & -20% for the year. If you did nothing but look at the index, you would have missed the large dislocation of the index performance and the performance of the underlying stocks.

The risk you should consider this year is contagion. This is the risk of assets selling off because other assets are selling off, having very little to do with underlying fundamentals. For example, if the high yield bond market continues to sell off or worse yet, crashes, then the investment grade corporate bond market may also sell off. This in turn could lead to a sell off in equities and other assets. The spread of this contagion is not knowable, but you should be aware of this risk.

Read More…

Inflation Monitor – January 2016 Read More »

Inflation Monitor – December 2015


Inflation Monitor Summary – Composite Ranking

Inflation Monitor Summary December 2015


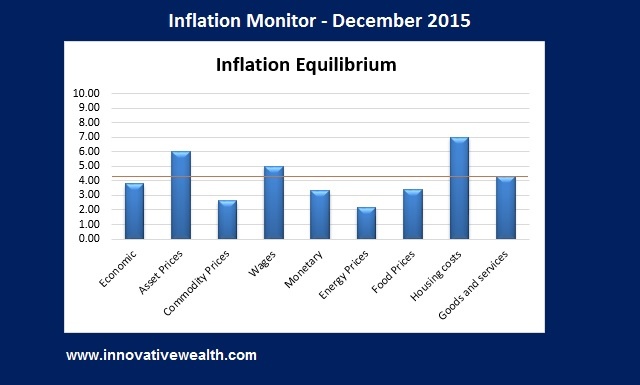
* The Inflation Equilibrium is a quick summary for the whole data series of the inflation monitor. If you don’t like statistics, this is the chart for you.


Inflation Monitor – December 2015 – Introduction

This is the last issue of 2015. I hope you are enjoying the holidays and getting ready to bring in the new year. While this is a joyous time of the year. It should be used to reflect on the past year and what surprises are to come in the next 12 months. While no one can know the future, we can look for signs that things are not quite right. These are what I would call new potential risks to the equilibrium of the global financial markets.

Read More…

Inflation Monitor – December 2015 Read More »

Inflation Monitor – November 2015


Inflation Monitor Summary – Composite Ranking

inflation monitor november 2015 summary

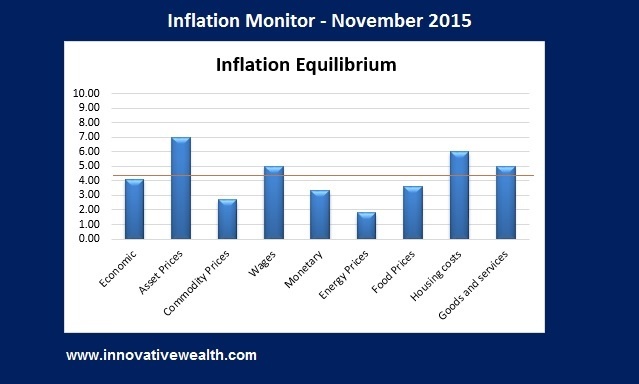
* The Inflation Equilibrium is a quick summary for the whole data series of the inflation monitor. If you don’t like statistics, this is the chart for you.


Inflation Monitor – November 2015 – Introduction

Looking at the past year I have to give a hearty laugh at the people to claim that the US Dollar is losing value. I wonder if these people own a computer, or have bothered to look at the US Dollar chart. It is included below along with the chart of gold (which is a long gold/short US Dollar trade) and a few other important  assets.

The important thing to know about the US Dollar is that putting a value to it is complicated because it is a fiat currency. This means there are more than one moving variables that need to be accounted for to determine whether it is rising or falling in value.

Take gold for example. Gold is a chunk of metal. People put a price on it of what they are willing to pay for it, but that is it. Its price is only determined what someone with a specific currency is willing to pay for it. Pricing an asset like gold is easy. Prior to being removed from the gold standard, the US Dollar was pegged to the price of gold, so there was an easy relationship which could be determined.

Now let’s take a look at the current version of the US Dollar in comparison. The US Dollar is a piece of paper, but also a whole lot more.

What is a US Dollar worth?

Read More…

Inflation Monitor – November 2015 Read More »

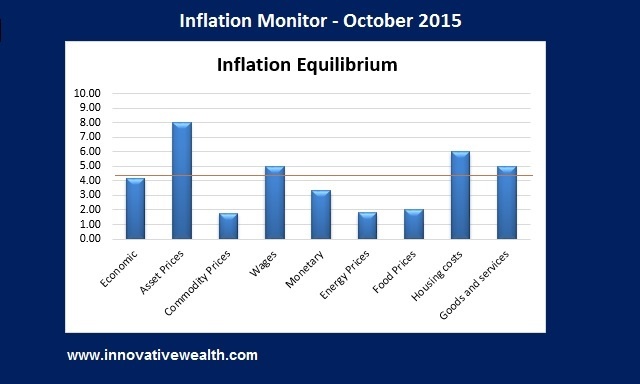
Inflation Monitor – October 2015


Inflation Monitor Summary – Composite Ranking

Inflation Monitor - Summary Oct 2015


* The Inflation Equilibrium is a quick summary for the whole data series of the inflation monitor. If you don’t like statistics, this is the chart for you.


Inflation Monitor – October 2015 – Introduction

The last month has been really interesting. My prediction seems to be coming true. I have stated for most of this year that the second half (3rd or 4th quarter) of this year would show the US entering into a recession. While I still believe that the US has a strong economy relative to the rest of the world. There are just too many factors bringing it down.

The powerful people in this country as well as many academic economists have been pushing for a more global economy for a few decades. Now that we have a more global economy, it is more interconnected than ever. With the benefits of this type of system, come drawbacks. Having global booms and busts is one of those symptoms.

Despite what the media personalities say on TV, the US is not an island. The US cannot decouple their economy from the rest of the world. I am not aware of this happening in any meaningful way for the past few decades. Prior to that, the global economy was not as interconnected, so any data would be less relevant. I have not looked at prior data, but I assume it has a similar theme to what we have now.

What is important to remember is that the global economy is interconnected by money flows, relative currency valuations, asset valuations, inflation, jobs and many other factors. Most countries are dependent on one or more other countries for their economic prosperity. Unless the worlds nations decide to get into a economic battle as they did going into the great depression, this dependency will not change.

While this service is called the inflation monitor, it is important to discuss the economy as well since it has such an important bearing on inflation and deflation. But as you know if you have been reading this for any amount of time, most of what is driving inflation or deflation at the moment is debt.

I do not want to be hyperbolic, but the debt bubble that exists today is extremely dangerous and when it pops, a huge amount of wealth will be destroyed. While this bubble can be managed, as it has been up to this point, the Fed is not strong enough to control the global economy’s debt.

There is one point I want to leave you with. Bear markets are dangerous, they are not a time to “make money”. The most important thing you can do in a bear market is to “not lose money”. Depending on the nature of it, this might be harder than you imagine.  Logic does not always prevail in a bear market. 2008-2009 should have taught you that lesson, please go back and refresh you memory.

Read More…

Inflation Monitor – October 2015 Read More »

Inflation Monitor – September 2015


Inflation Monitor Summary – Composite Ranking

Inflation Monitor Summary 09.15

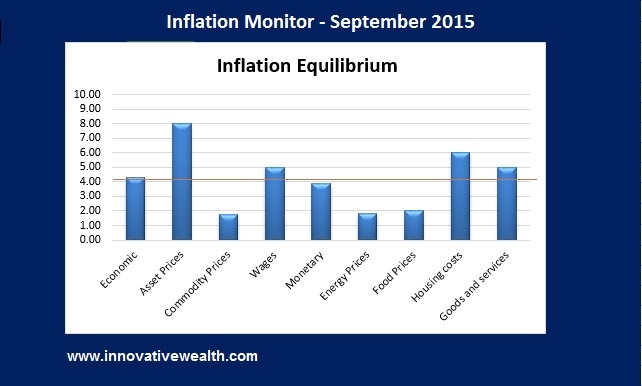
* The Inflation Equilibrium is a quick summary for the whole data series of the inflation monitor. If you don’t like statistics, this is the chart for you.


Inflation Monitor – September 2015 – Introduction

“Inflation is always and everywhere a monetary phenomenon in the sense that it is and can be produced only by a more rapid increase in the quantity of money than in output”   – Milton Friedman

This is the 12th issue of the Inflation Monitor. During the entire year that we have published this report, the trend has been deflationary. This is contrary to what many economists and fear mongers are claiming. the US has created an enormous amount of money and this should have caused inflation, yet other than the stock market, this is not the case. There are a number of reasons for this, but one thing is clear, the deflationary forces are strong and persistent.

This past month, The stock market swooned and dropped a bit more than 10% during the month…

Read More…

Inflation Monitor – September 2015 Read More »

Inflation Monitor – August 2015

Inflation Monitor Summary – Composite Ranking

inflation monitor summary


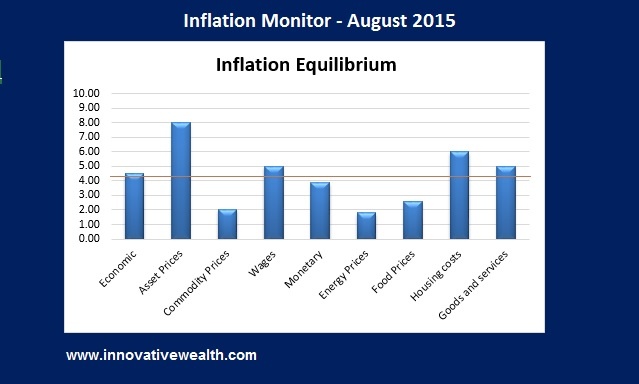
* The Inflation Equilibrium is a quick summary for the whole data series of the inflation monitor. If you don’t like statistics, this is the chart for you.


Inflation Monitor – August 2015 – Introduction

The lazy days of summer are almost over. As the summer ends, the Wall Street traders and money mangers will also be going back to work. If you looked at a chart of the S&P 500 without the dates, you would not be able to tell which days were summer days and which were not. It looks like the traders have been in vacation for the entire year.

The S&P 500 has been fluctuating around 0% all year long. It is kind of refreshing to know that there is another direction other than straight up. The end of the year has a chance to be very interesting considering the speculation that the Federal Reserve will be raising rates. While I have said many times I think the Fed will lock the floating rate of 0%-.25% at .25% as a starting point, this will amount to nothing. This might even be a catalyst for the market to resume its march higher, if the Fed says that they will stop and assess the markets reaction before raising again.

The US stock market is already very overpriced according to a number of metrics, but until there is a better place for investors to put their money, it may remain expensive. The Chinese stock market has been unraveling in the past few months and this may be a catalyst to move global markets. It is too soon to tell. Keep watching Chinese markets as a sign of trouble ahead.

The rise in interest rates has cast some interesting speculation on the future movements of the stock market. I want to dispel some of the myths about the rise in interest rates. In short, historical data suggests that the stock market rises with the rising rates, but what is not explained is that the rates start rising to stop the excessive rise in the stock markets. In fact in recent history, the Fed has raised interest rates until the stock market slows. Inevitably the Fed overshoots the mark and causes the market to decline. The US has had 0% interest rates since 2009. This is a long time with low rates. I am surprised the market is not higher.

This month’s inflation monitor data once again show the US market is experiencing deflation. I have not heard more than a handful of people discussing this deflationary data. I am wondering when more people are going to recognize this fact. I suppose that will be when the markets turn, then everyone will have seen it.

I hope you enjoy this month’s Inflation Monitor – August 2015.

Kirk Chisholm

Read More…

Inflation Monitor – August 2015 Read More »

Inflation Monitor – July 2015

Inflation Monitor Summary – Composite Ranking

Inflation Monitor Equilibrium

* The Inflation Equilibrium is a quick summary for the whole data series of the inflation monitor. If you don’t like statistics, this is the chart for you.


Inflation Monitor – July 2015 – Introduction

I hope you enjoyed your Independence Day. While Greece may not have the same appreciation of our holiday, they had one of their own… A Bank holiday. While the Greek Crisis in Europe seems to be solved??? The greater problem persists. The Greek people voted a resounding “NO” on the terms and the Greek PM moved forward with it anyway. Apparently Greece is happy kicking the can down the road, and I can’t blame them. They can never pay back the debt they owe and they are getting additional loans to pay the interest in the loans they already have. Europe seems to want to keep them in the EU for other reasons, but the end result is that they eventually will have to deal with this. I’m sure the politicians would rather this problem breaks loose on someone else’s watch. Everyone wins by prolonging this and everyone loses eventually by letting this happen.

The US Markets continue to be quiet with no additional QE and a prospective tightening in the near future. The economy continues to be strong, but some signs are cropping up in small amounts showing that caution is warranted. I have added a few charts to this issue that I found interesting this month.

I hope you enjoy this month’s Inflation Monitor – July 2015.

Kirk Chisholm

Read More…

Inflation Monitor – July 2015 Read More »

Inflation Monitor – June 2015

Inflation Monitor Summary – Composite Ranking

Inflation Monitor Summary


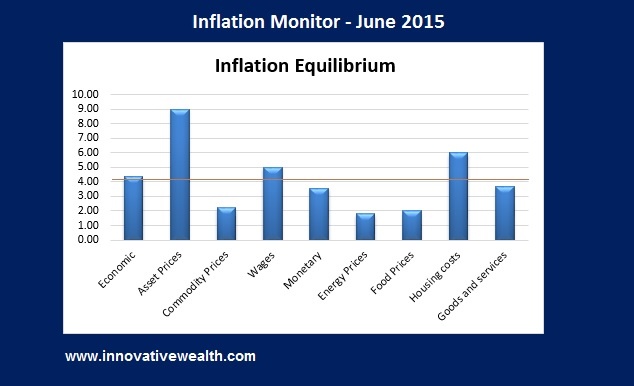
* The Inflation Equilibrium is a quick summary for the whole data series of the inflation monitor. If you don’t like statistics, this is the chart for you.


Inflation Monitor – June 2015 – Introduction

It is officially summer and most markets are becoming more quiet. This is of course excluding the ongoing crisis in Greece. They must love the attention because they have been dragging out this “crisis” since 2011. Everyone involved in this mess (on both sides) has a reason to kick the can down the road forever, but forever will not last that long. Greece has call for a referendum vote from the people. We will find out what the people want next week.

While the US markets have been quite, there have been some disturbing signs cropping up in some of the economic indicators that we follow. These are: the velocity of money, PPI, and market cap to GDP. While many of the numbers listed above show deflation, these three are especially concerning. One interesting and potentially inflationary sign is a sharp pickup of the Baltic dry Index.

Enjoy this month’s Inflation Monitor – June 2015.

Kirk Chisholm

Read More…

Inflation Monitor – June 2015 Read More »

Scroll to Top