baltic dry index

Inflation Monitor – February 2016


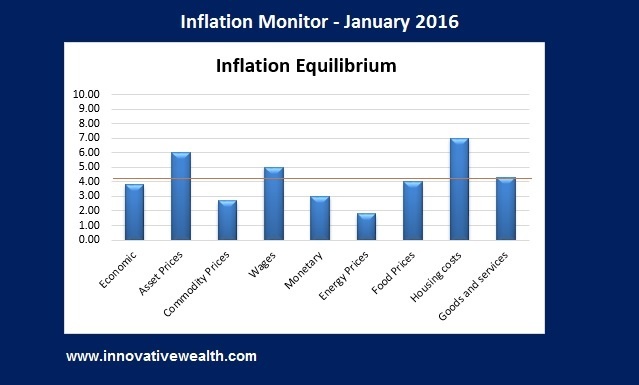
Inflation Monitor Summary – Composite Ranking

Inflation Monitor Summary December 2015
 

Inflation Monitor – February 2016 – Introduction


It is February, and winter has finally arrived in the northeast. Not only has the weather turned cold, but so have the markets. The stock markets started the year off cold with the worst start to January performance on record and ending with the S&P 500 down -3.37% for the month. The start of February has not been great either. As I write this the S&P 500 is at its lowest levels since February 2014.

Generally this Inflation Monitor is not focused on the stock markets, but I have been wondering for the past year how long it would take for the stock market to realize that deflation was strong and growing stronger. Apparently it is now on the table since Japan lowered their interest rates into negative territory to join their European brothers. The idea of negative interest rates should be an episode of the twilight zone. It is new to almost everybody and how this plays out will certainly be interesting. What is the definition of insanity? Doing the same thing over and over and expecting different results. (this was not said by Einstein, although frequently attributed to him).

Gold has finally picked up steam in the past few weeks with the metal up over 10%. Maybe it the fear of negative interest rates that is driving the flight to safety in gold. With the rest of the commodity complex still in a bear market, I doubt gold and silver prices will start a new bull market. Only time will tell, but despite the rise in gold price in US Dollars, it is important to note the price of gold in other currencies (see this below in the gold section).

I mentioned this last month, and I’ll mention it again.

If you have not read my 2015 recap, then now is a good time to read it. Last year the S&P 500 ended with a performance of -0.7%, which is surprising since many blue chip companies were down between -10% & -20% for the year. If you did nothing but look at the index, you would have missed the large dislocation of the index performance and the performance of the underlying stocks.

The risk you should consider this year is contagion. This is the risk of assets selling off because other assets are selling off, having very little to do with underlying fundamentals. For example, if the high yield bond market continues to sell off or worse yet, crashes, then the investment grade corporate bond market may also sell off. This in turn could lead to a sell off in equities and other assets. The spread of this contagion is not knowable, but you should be aware of this risk.

 
Read More…

Inflation Monitor – February 2016 Read More »

Inflation Monitor – July 2015

Inflation Monitor Summary – Composite Ranking

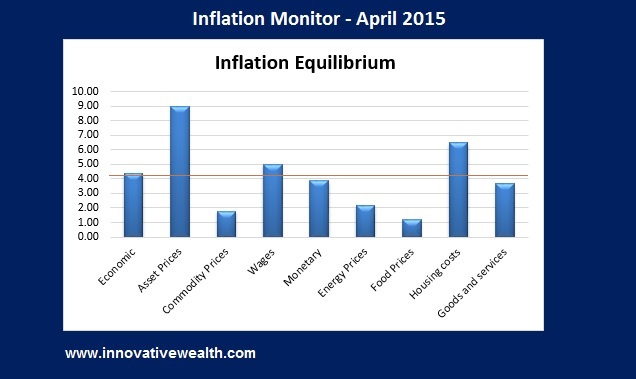
Inflation Monitor Equilibrium

* The Inflation Equilibrium is a quick summary for the whole data series of the inflation monitor. If you don’t like statistics, this is the chart for you.


Inflation Monitor – July 2015 – Introduction

I hope you enjoyed your Independence Day. While Greece may not have the same appreciation of our holiday, they had one of their own… A Bank holiday. While the Greek Crisis in Europe seems to be solved??? The greater problem persists. The Greek people voted a resounding “NO” on the terms and the Greek PM moved forward with it anyway. Apparently Greece is happy kicking the can down the road, and I can’t blame them. They can never pay back the debt they owe and they are getting additional loans to pay the interest in the loans they already have. Europe seems to want to keep them in the EU for other reasons, but the end result is that they eventually will have to deal with this. I’m sure the politicians would rather this problem breaks loose on someone else’s watch. Everyone wins by prolonging this and everyone loses eventually by letting this happen.

The US Markets continue to be quiet with no additional QE and a prospective tightening in the near future. The economy continues to be strong, but some signs are cropping up in small amounts showing that caution is warranted. I have added a few charts to this issue that I found interesting this month.

I hope you enjoy this month’s Inflation Monitor – July 2015.

Kirk Chisholm

Read More…

Inflation Monitor – July 2015 Read More »

Inflation Monitor – June 2015

Inflation Monitor Summary – Composite Ranking

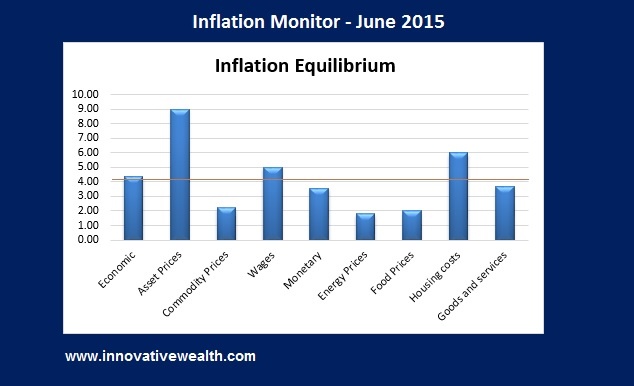
Inflation Monitor Summary


* The Inflation Equilibrium is a quick summary for the whole data series of the inflation monitor. If you don’t like statistics, this is the chart for you.


Inflation Monitor – June 2015 – Introduction

It is officially summer and most markets are becoming more quiet. This is of course excluding the ongoing crisis in Greece. They must love the attention because they have been dragging out this “crisis” since 2011. Everyone involved in this mess (on both sides) has a reason to kick the can down the road forever, but forever will not last that long. Greece has call for a referendum vote from the people. We will find out what the people want next week.

While the US markets have been quite, there have been some disturbing signs cropping up in some of the economic indicators that we follow. These are: the velocity of money, PPI, and market cap to GDP. While many of the numbers listed above show deflation, these three are especially concerning. One interesting and potentially inflationary sign is a sharp pickup of the Baltic dry Index.

Enjoy this month’s Inflation Monitor – June 2015.

Kirk Chisholm

Read More…

Inflation Monitor – June 2015 Read More »

Inflation Monitor – April 2015

Inflation Monitor Summary – Composite Ranking

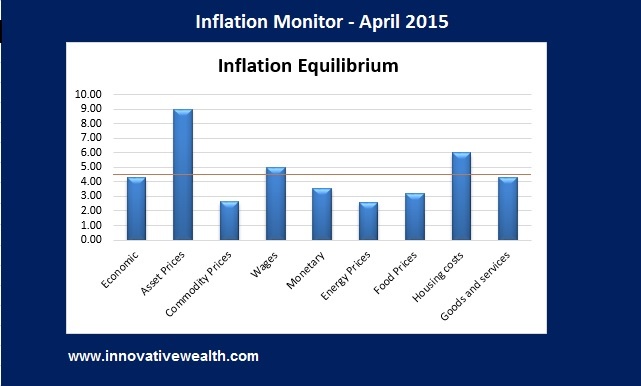
Inflation Monitor Summary - April 2015


* The Inflation Equilibrium is a quick summary for the whole data series of the inflation monitor. If you don’t like statistics, this is the chart for you.


Inflation Monitor – April 2015 – Introduction

Spring is finally here and with it comes the warm weather. Unfortunately the warm weather has not been able to thaw out deflation or the wintery economic chill that has gripped certain parts of the US economy and many European nations.

The CPI continues to hit negative territory on an annual basis for the second month in a row. The PPI is well into negative territory as well. This does not bode well for the US economy.

Commodity prices have also continued to show weakness. The bright spot in the US economy is housing which has been climbing for the past few months and started to pick up its pace.

There are many excuses that have been proposed for these numbers: the heavy snowfall in the North East this past winter, the significant drop in oil prices, the rising US Dollar, and more. These are all valid reasons for the drop in the CPI, PPI, and other economic data. However what I find amusing is the commentators who claim the high oil prices were a good thing for the economy, now say that low oil prices are good for the economy… Well which is it?

The stock market is not the economy”  – Author Unknown

This axiom is more important than any you will learn about the stock market. What it means is that the economy does not always lead or follow the actions of the stock market. While they are obviously related, they are not the same.

The US stock market is currently holding up well considering the negative economic data. While the two are highly correlated, they do not always act in unison. However I do expect the stock market to follow the economic trends in the second half of this year unless we see a sharp reversal in trend of the US Dollar and Oil.

In this months Inflation Monitor I have some very interested charts to share with you. Enjoy.

As always, please contact me to send your feedback on how I can make this monthly Inflation Monitor a better tool and resource for you. Thank you for reading and I hope you enjoy this month’s issue – Inflation Monitor – April 2015.

Join our email list to receive the Inflation Monitor sent directly to your inbox.

Inflation Monitor Monthly


Kirk Chisholm

Read More…

Inflation Monitor – April 2015 Read More »

Scroll to Top