
Inflation Monitor Summary – Composite Ranking

The Inflation Monitor is a monthly report that tracks inflation trends. We do this by monitoring various economic indicators, asset prices, and goods and services. The purpose of the Inflation Monitor is to provide more clarity to the CPI number for the average investor.
We summarize the Inflation Monitor statistical data into the Inflation Monitor Equilibrium. This equilibrium summary was devised to help investors understand the impact of economic statistics and what areas of the economy are providing inflationary pressures and which are providing deflationary pressures.
The numbers on this summary are a rating score of the amount of inflation or deflation that exists in a segment of the economy. 10 is the highest score possible to indication high inflation. 1 is the lowest score indicating high amounts of deflation. The brown line indicates the average number of all 9 components of the economy.
Inflation Monitor – September 2016 – Introduction
We are back… After a summer of great weather, we have returned with the September 2016 edition of the Inflation Monitor. I want to apologize to all our readers for not writing an August edition, but if you were paying attention to the global economy in August (and you might be the only one), then you will realize that virtually nothing happened of note. Sure prices changed and economic numbers moved, but if you look at the stock markets, no one noticed and the volume shows that very few people were even working. However, kids are going back to school, Wall Street traders are back from vacation, so should we expect to see more activity? We will soon find out.
If you start to notice the obvious elephant (or donkey) in the room, the US presidential elections are coming up and the ensuing fireworks will most likely be moving the markets. In July, I watched an interesting assessment of the presidential election presented by Larry Lindsey and it provided a few scenarios of outcomes based on certain events happening. While I don’t have the slides, it was truly astounding. I’ll spare you the details except to point out two notable items that I took away from the event.
- All of the most notable political election handicappers have said that the models they use for handicapping elections are not working with this election, and they cannot provide an accurate prediction. Translation: no one can give you a reliable prediction of this election. This means more volatility since the market does not like uncertainty.
- After reviewing many of the possible scenarios the conclusion is that the election will be close.
I would be surprised if any election from now until eternity is anything but close. Regardless of the winner, no one from either party wants it to be a landslide. Either way, the major beneficiary is going to be the media, who are actually finding something of note to talk about 24 hours a day.
I still feel like I’m listening to Charlie Brown’s teacher when the TV new anchors are discussing… just about any topic. I know I’m not alone in this sentiment. My favorite example of this is when Warren Buffett was on CNBC a few years ago and the media “personality” who was interviewing him, continuously interrupted Warren to tell everyone what he thought about the markets. I felt like calling the station and saying “hey bozo, no one cares what you think about the markets… unless you have a track record like Warren Buffett, you probably should not be interrupting him during an interview.” And CNBC is still wondering why their ratings are at historic lows.
But I digress. Here is a quote from Richard Fisher, who is a former Dallas Fed president and has real life business experience, which is a rare trait at the Federal Reserve.
“ZIRP – NIRP doesn’t appear to be effective at all.”
“Theoretically, negative interest rates work; in practice, they do not.”
“It (the Fed) has fueled an artificial market.”— Richard W. Fisher
At Jackson Hole, where anyone of note meets once a year to discuss monetary policy, the Fed officials discussed negative interest rates (in a positive light). I guess that means we can expect negative interest rates in the near future when the economy turns south. This will be a horrendous mistake, but it will be just one more horrendous mistake in a sequence of mistakes made by the Fed officials. Asset prices are based on an artificial market. Everyone who makes a living in the financial markets knows this.
The financial markets are a game of musical chairs. My fear is not that there won’t be enough chairs when the music stops, my fear is that there won’t be any chairs. Unfortunately, as Chuck Prince of Citigroup said in an interview with Financial Times, “When the music stops, in terms of liquidity, things will be complicated. But as long as the music is playing, you’ve got to get up and dance. We’re still dancing,”
I think Chuck accurately describes the financial markets. Everyone has to get up and dance until something bad happens. Then everyone runs for the door. When institutions want to invest in safe assets they typically flock to US Treasuries, but with the Federal Reserve and Central banks around the world buying up sovereign debt, will there be enough liquidity for everyone? I guess we will find out when it is too late.
One of the problems we have in publicly traded markets is that asset prices are based on an artificial market. Everyone who makes a living in the financial markets knows this. The two questions I have are this, how do we know what the true price of an asset is when the prices are being manipulated by central banks around the world? Second, What is going to happen when the next recession hits and we still have a ZIRP (zero interest rate policy)?
My guess is that we become Japan.
A thought experiment for you to consider:
I want you to conduct a thought experiment. Partially because we have never experienced negative interest rates on the grand scale at which they exist in the global economy, and partially because I’m not sure if anyone knows the answer. Here is the thought: Currently there are sovereign and corporate bonds which are “paying” a negative interest rate of -0.01% to -0.44%. So if you buy a -0.44% bond for $1,000, you will lose $4.40 each year on that bond. At the end of 10 years, you will have a net of $956. What a deal? Yet people are buying these bonds which are guaranteed to lose $44 over 10 years.
Here is the question. When you buy a bond with a positive interest rate, you have an asset. When you borrow money at a positive interest rate, you have a liability. When happens when interest rates go negative? Do your assets turn into liabilities and your liabilities turn into assets?
The world financial system is based on certain fundamental concepts being true. One of the assumptions most people have is that when you borrow money, you have to pay interest on that money to borrow it. However, if you get “paid” interest to borrow money, how much would you borrow? My answer would be, “as much as they will give you.” Think about it for a second. Let’s say you get a mortgage for $1,000,000 at a rate of -1.00%. Instead of paying $10,000 a year in interest, the lender would pay you $10,000 a year to borrow money. I’ll reiterate my question. How many houses would they let me have at negative interest rates?
I think the Federal Reserve has a lot of questions to answer before they take the US to negative interest rate territory.
I have one final question before I sign off, Can you name one publicly traded market that is not being manipulated by a central bank or government? Please write in if you can name one.
P.S. You may have noticed that we did not have the huge data sheet at the top of the page this month. Next month we will be redesigning the site to make it more user-friendly. Please write in to give us your thoughts. Let us know if you want to see the data tables brought back.
I hope you enjoy this month’s Inflation Monitor – September 2016.
Kirk Chisholm
![]()
Reference Pages:
- Historical Inflation Rates
- Inflation – The Secret To Building Wealth In Real Estate
- Deflation – How a Mortgage Can Destroy Your Real Estate Wealth
Quotes of the Month
“Debt is future consumption brought forward. Once debt is incurred, consumption that might have happened in the future won’t happen, and it should come as absolutely no theoretical surprise that at a certain level of debt, growth and income begin to diminish. That is exactly what we are seeing in the real world, even if those who espouse the reigning economic paradigm (Keynesianism) are still in love with their beautiful theory.”
Charts of the Month
Interesting Inflation Charts
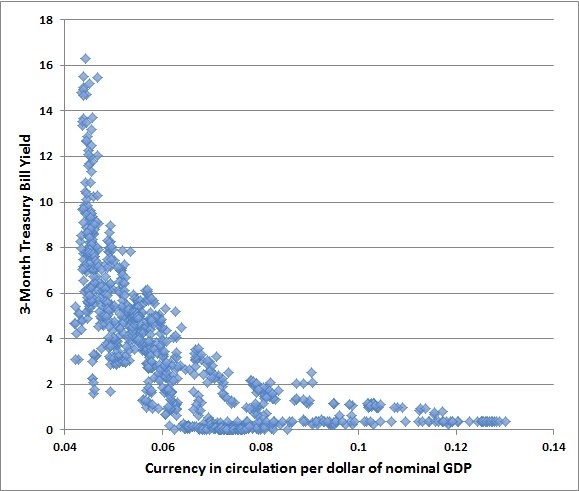
I think I am going to make this chart a permanent part of this inflation monitor so that the importance of it is not missed. John Hussman put this chart in one of his weekly reports a while ago. If I could find the report, I would link to it. You should definitely read his weekly reports. It was a great report about how interest rates relate to the amount of money in circulation. The basic idea is that as rates climb higher, there is less money in circulation, and when rates are low as they are today, there can be an enormous amount of money in circulation without causing high inflation. This idea is a basic concept in economics, however, what is most interesting is seeing this visually.
Think of it this way, if hypothetically the US government can support a debt of $100 at a 5% rate of interest ($5 a year), then how much can the US support at 0.05%? $10,000 or a 100x increase. If rates are at zero, then the number becomes infinite. Now, what if interest rates are negative, why wouldn’t the US print an infinite amount of money?
Obviously, this is hypothetical, but it is important to understand this principal. Once you do, then this is the important part you don’t want to miss. Look at the slope of the curve in this chart. While you may be able to exponentially increase the supply of money without increasing your debt service, the hard part is when you try to increase rates. You will learn very quickly that the debt is unsustainable. If you want to see why interest rates will not rise quickly around the world, this is it. Once you have created $10,000 in debt you will have to reduce it by 99% to reach the 5% rate you had originally. What are the chances of this happening?
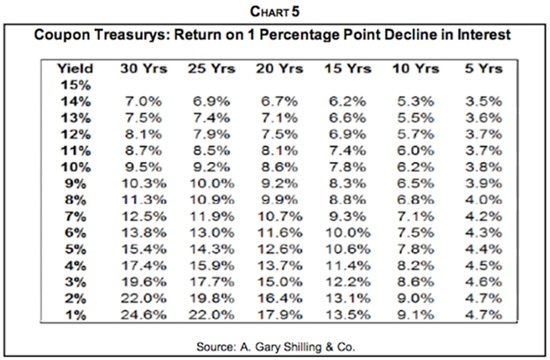
Interest Rate Sensitivity
I think this is one of the most important charts you will look at this month. Quite frankly you should know this inside and out if you have any money at all in bonds. I say this because we are at what could be the end of a historic bond bull market. Sure we could continue lower into negative interest rate territory, but let’s be serious for a moment. Do you think that will last?
Oddly enough, if you listen to the money mandarins of each country’s central bank, this is an experiment they are willing to try… because they have run out of ideas.
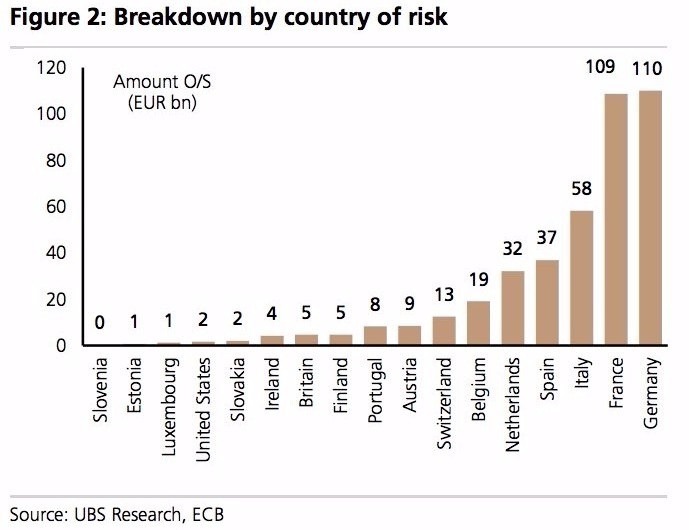
ECB Buying Bonds
The ECB (European Central Bank) and almost every other major central bank around the world has been buying bonds as if they are going out of style. What happens when they run out of sovereign bonds to buy? Well, in the case of the bank of Japan, they start buying corporate bonds. When they cannot buy more corporate bonds, they buy domestic equities. What happens when they run out of those? I guess they either buy foreign bonds and equities, or they start throwing cash from helicopters.
I have always been curious, the amount of money in circulation is created, then the banks take deposits and lend them out multiplying the amount of money in circulation, so in essence, the banks create money. If you didn’t know that, you should. Our financial system is built upon this premise. So what happens when the central banks buy up all these assets? Inflation of asset prices. Great! mission accomplished… oh wait. What does higher asset prices have to do with anything? Good question. Who cares about higher assets prices? Investors, institutions, and rich folk. Nothing against any of these people or entities, but that does not help our economy function. Sure everyone wants higher asset prices, but that does not do anything to create jobs, higher wages, make basic necessities more affordable, lower expenses or costs.
In a normally functioning economy, all asset prices (generally) rise together. This is what inflation is supposed to provide. However, this is not happening. So when asset prices rise, and wages do not, then this causes a problem. For example, let’s say that house prices rise from an average $500,000 to $1,000,000 and wages do not rise. Then it becomes much less affordable for homeowners to buy a house. Sure it’s great if you own a home, but what about the people who don’t.
Essentially this causes inefficiencies and eventually, the economy must correct itself.
Capitalism, in essence, requires Schumpeter’s “creative destruction”. This is what makes capitalism work. Without this creative destruction, you have Japan. Here is a great quote from Bill Gross from his latest monthly letter
I and others however, have for several years now, suggested that the primary problem lies with zero/negative interest rates; that not only do they fail to provide an “easing cushion” should recession come knocking at the door, but they destroy capitalism’s business models – those dependent on a yield curve spread or an interest rate that permits a legitimate return on saving, as opposed to an incentive for spending.
They also keep zombie corporations alive and inhibit Schumpeter’s “creative destruction” which many argue is the hallmark of capitalism. Capitalism, almost commonsensically, cannot function well at the zero bound or with a minus sign as a yield. $11 trillion of negative yielding bonds are not assets – they are liabilities.
Factor that, Ms. Yellen into your asset price objective. You and your contemporaries have flipped $11 trillion from the left side to the right side of the global balance sheet. In the process, you have deferred long-term pain for the benefit of short-term gain and the hopes that your ancient model renormalizes the economy over the next few years.
It likely will not. Japan is the petri dish example for the past 15 years. Other developed market economies since Lehman/2009 are experiencing a similar fungus.
— Bill Gross, “How I Found My Golf Game But Lost My Wife to a Titleist.”
I think Bill Gross’ description of the global problem we face is very accurate and a look into the future. In case you are not familiar with what is happening in Japan — Deflation.
The Fed owns 35% of all US Treasuries longer than a 5-year maturity. Could we possibly make it easier for our politicians to spend our money? We create US Treasuries, the Federal Reserve buys them, and our elected officials spend the funds.This is money being created and spent by our politicians for whatever they want, not what we want (unless you are a “friend” of theirs). What makes it worse is that the politicians are getting used to this type of incentive structure. It will be hard to break them of this habit. It is essentially free money for them to do what they please. Call me crazy, but I think these funds would be better spent by the taxpayers. At least with the taxpayers there is a free market approach to the funds going where they are needed.
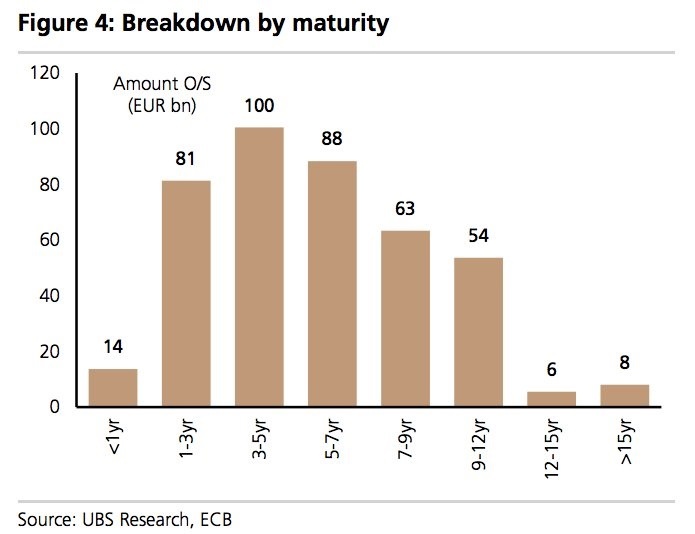
Here is what the ECB is doing with their Bond purchases and what bonds they are buying.
By Country
By Maturity
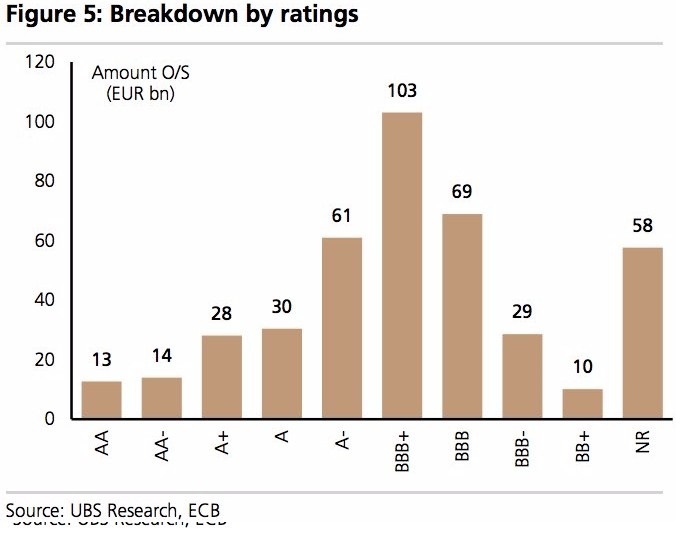
By Ratings
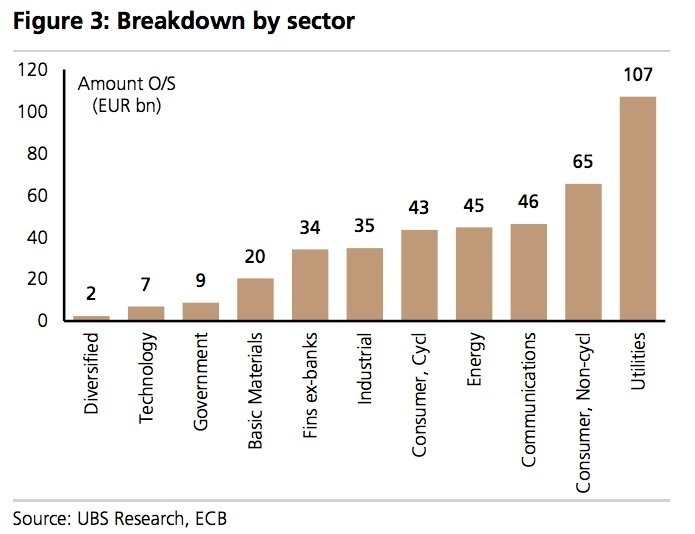
By sector
German Bunds
German Bunds are out of the cellar and back into positive territory. I suspect that when they reach a reasonable level, buying will resume.
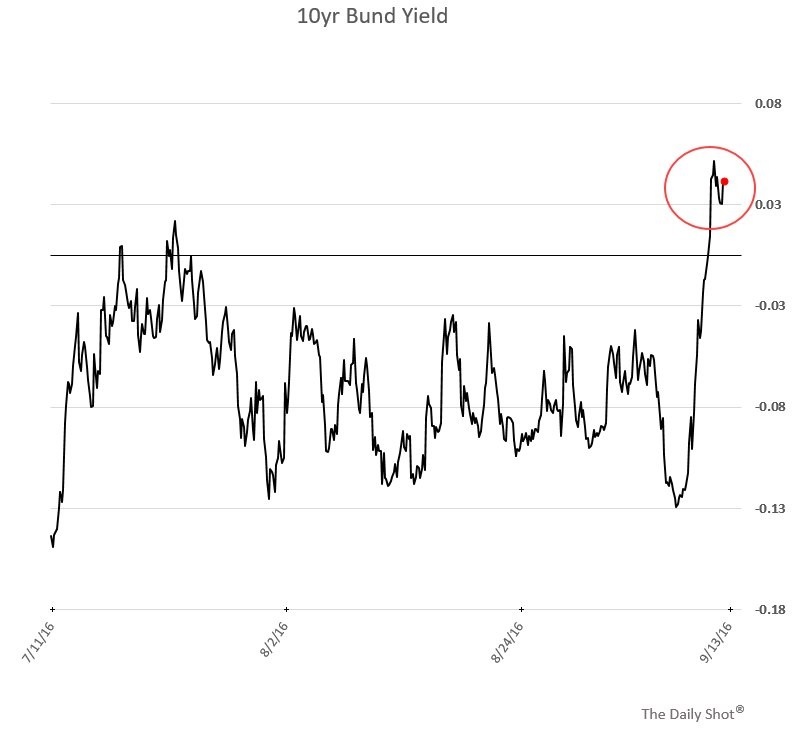
It looks like institutions are expecting global interest rates to rise due to a lack of further buying from central banks and institutions… Although the ECB bond buying program is not completed yet. So this is interesting.
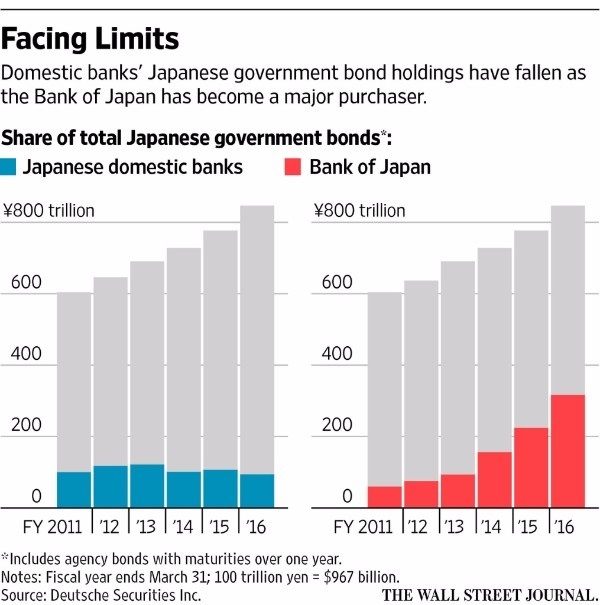
Bank of Japan Bond Buying
Canada Housing Prices
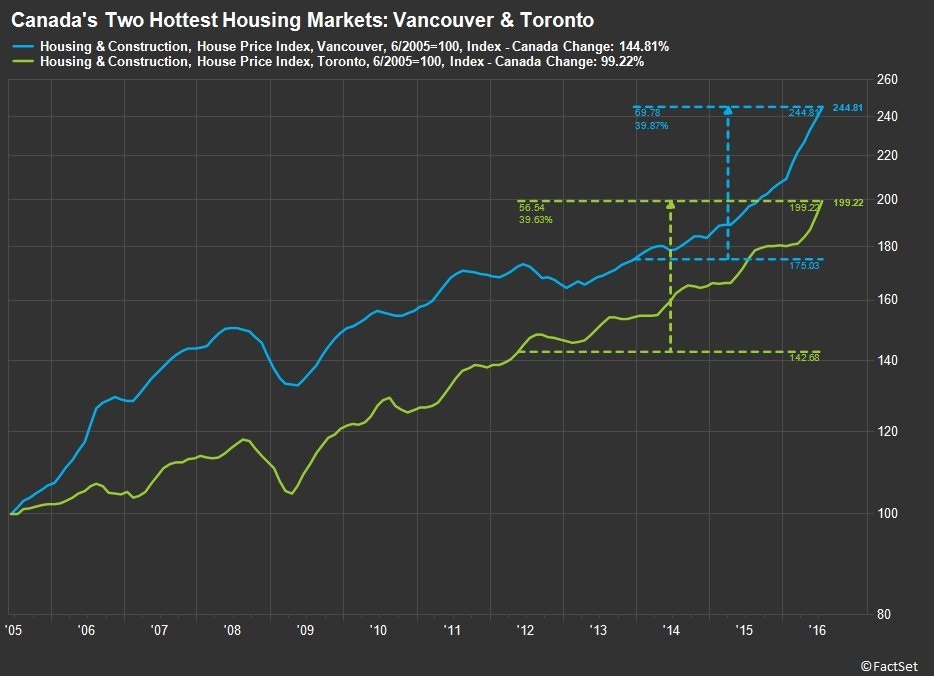
These prices are primarily driven by foreign capital, much of which is from China.
Daily money flows in/out of EM bonds
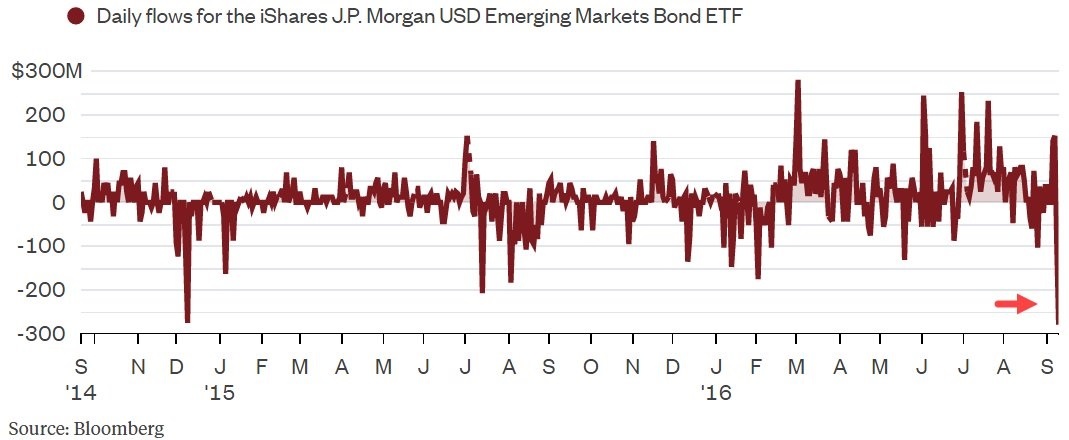
It looks to me like there is a rush for the door on these EM bonds. I wonder if this will get worse, or if it is just a knee-jerk reaction… like hte Brexit.
Summer Market lacks volatility
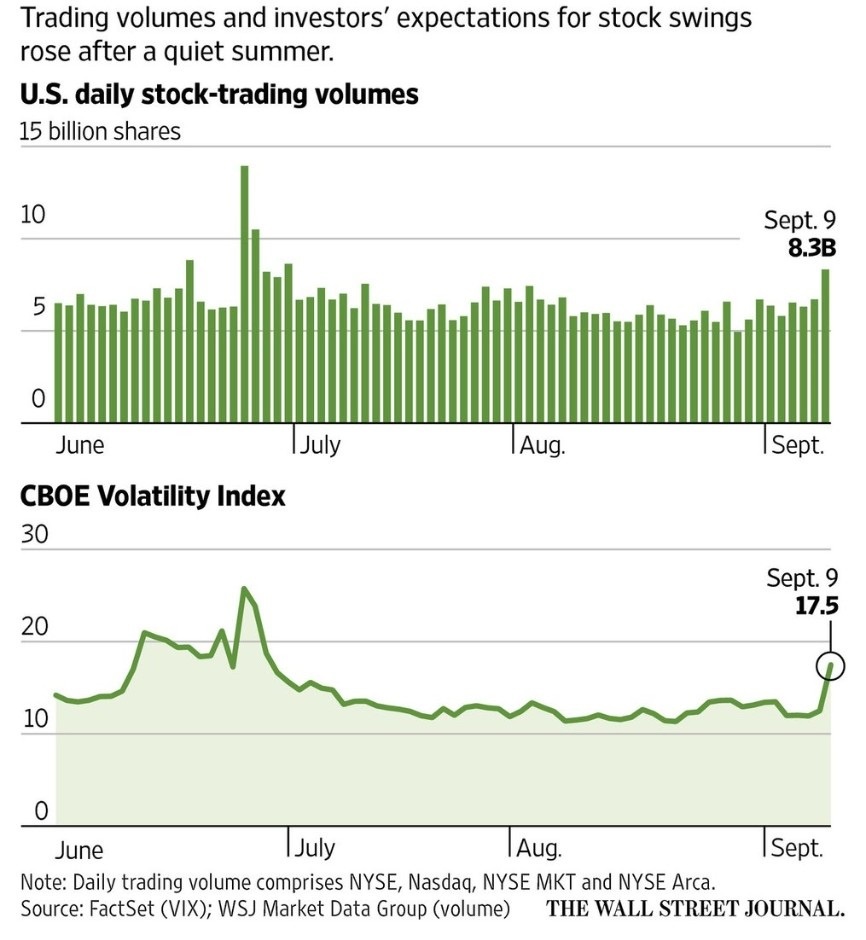
The summer of 2016 marks a significant lull in the equity markets. This is not surprising since many Wall Street bankers and traders hit the beach. However given the “interesting” US presidential election we have this year, I would have suspected that the volatility should have been a bit higher.
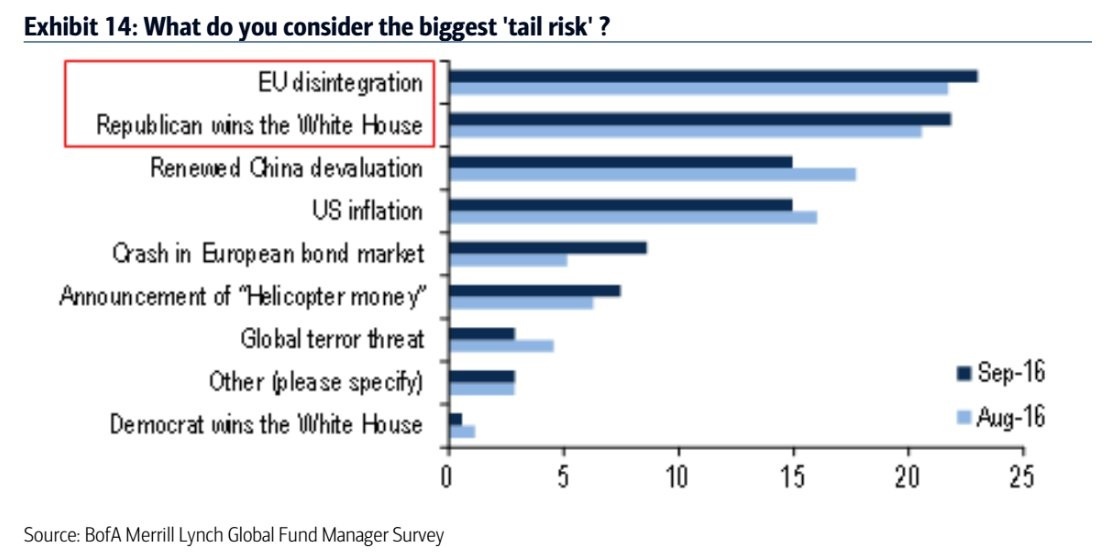
Current Tail Risks
I find it interesting that out of the top 9 no one is concerned about deflation. I guess it is safe to put “deflation” in the tail risk category. One way to characterize tail risks is that they are risks that almost no one is considering as a risk. They can also be referred to as black swans.
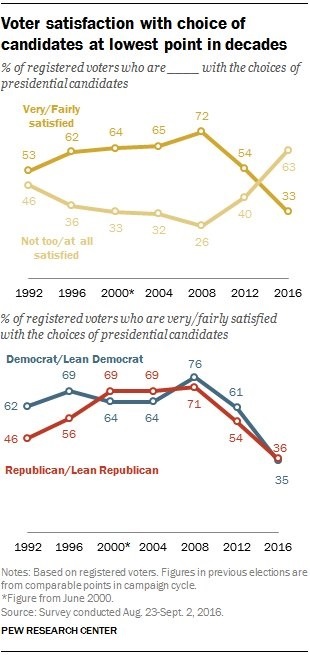
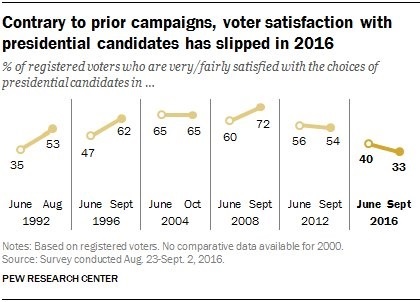
US Voter Satisfaction
These charts show what most of us are feeling…
“Really??? These are our choices? Why could we not have better choices?”
It is clear that neither party is happy.
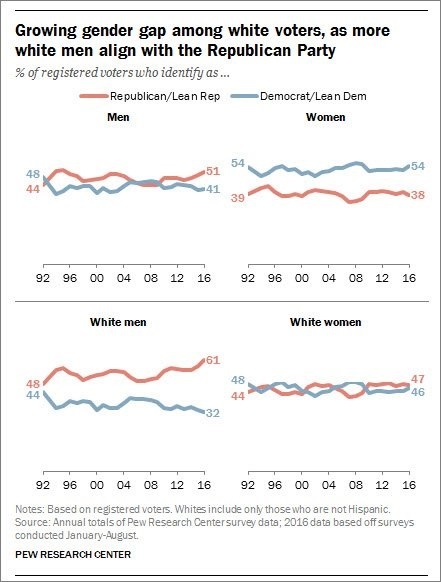
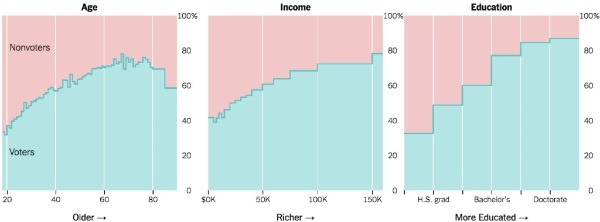
Voting Demographics
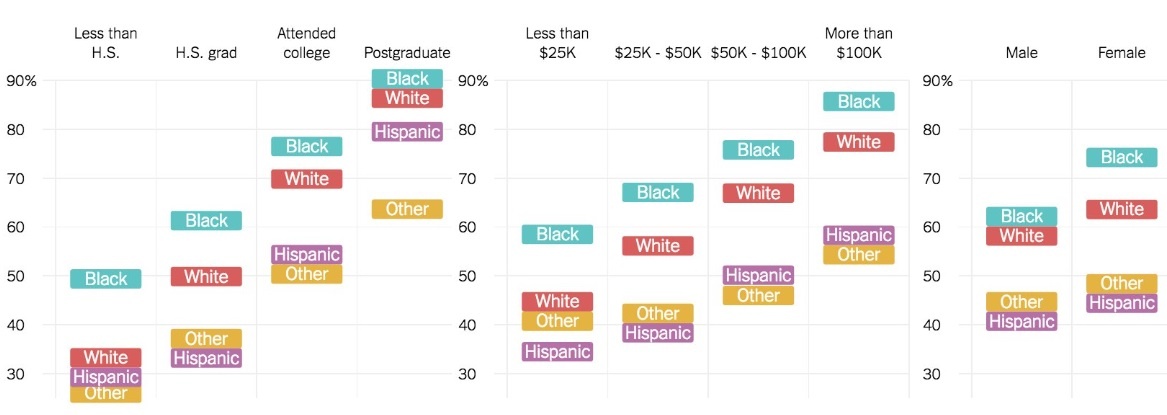
Voting demographics in 2012
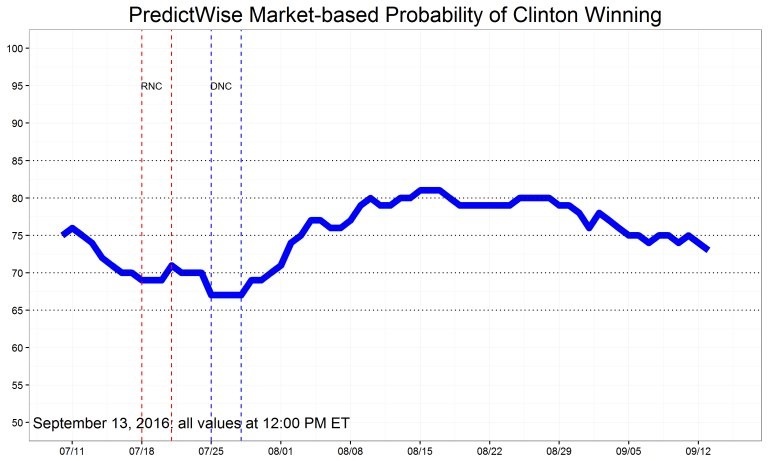
One oddsmaker’s prediction of US presidential election
Leading Indicators
Dr. Copper
Dr. Copper is still weak, despite the recent bounce. Much of this has to do with global demand… or the lack of it. Primarily this demand has come from China in the past 10 years. Unless China restarts its economy with a push for more manufacturing, it might be a while before copper regains its former highs. Copper prices are consolidating at these levels.

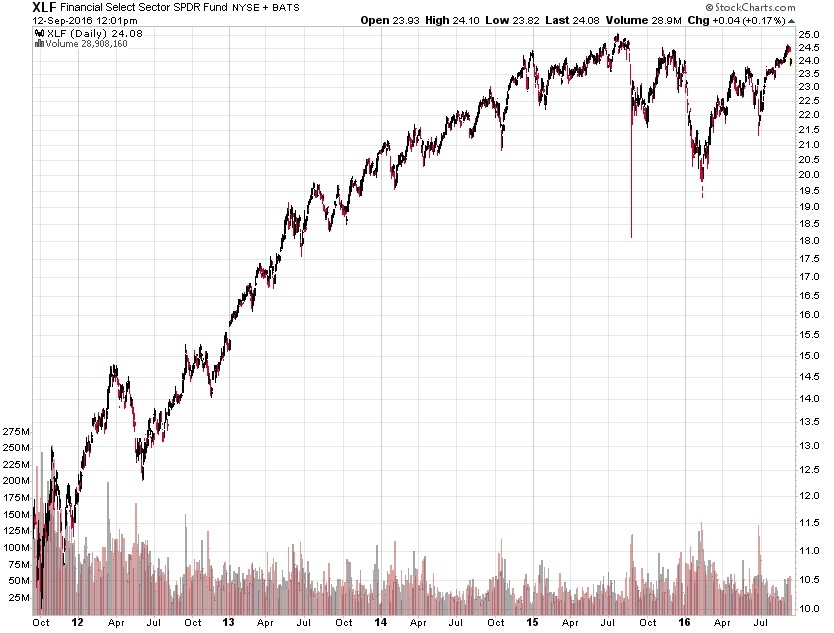
Financials
Fed raised interest rates in December. There hasn’t been one since. There is less than a 50% change they will raise before the year is done, but given the fact that the Fed is more worried about the global economy than the US, I don’t expect to see one at all. The big question is, how is the financial sector going to make money when the spread is shrinking and rates continue to drop and go negative? How will insurance companies and pension funds survive? One more question… What happens when the US has negative interest rates, and that causes people to pull money out of the financial system. If banks create money (and they do via the banking process of lending), this causes inflation. What happens when money is pulled from the system, this could cause a huge amount of deflation to hit most markets. Keep that in the back of your mind if the Fed experiments with negative rates.
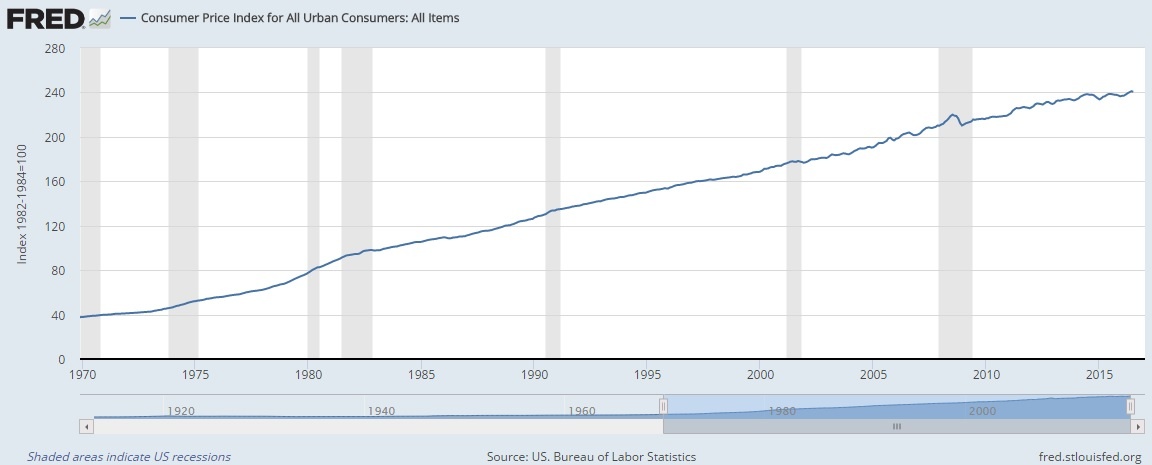
Consumer Price Index (CPI)
Inflation is caused by excess demand. Historically this is caused by a fully-employed economy which also has a huge government spending program in place (which frequently happens in wars).
The CPI is flat for the year. It just started picking up again. If you have read this Inflation Monitor report for the last 12 months you will know that strong deflationary forces are here to stay. The Fed does not want deflation in the US, but can they stop it?
Producer Price Index (PPI)
The Producer Price Index is continuing to have a rough time this year. The declining PPI might be a reflection of the new economic conditions of producers and manufacturing with a high value of the US Dollar. This makes it harder for US companies to export goods since they will be about 20% more expensive from where they were last year.

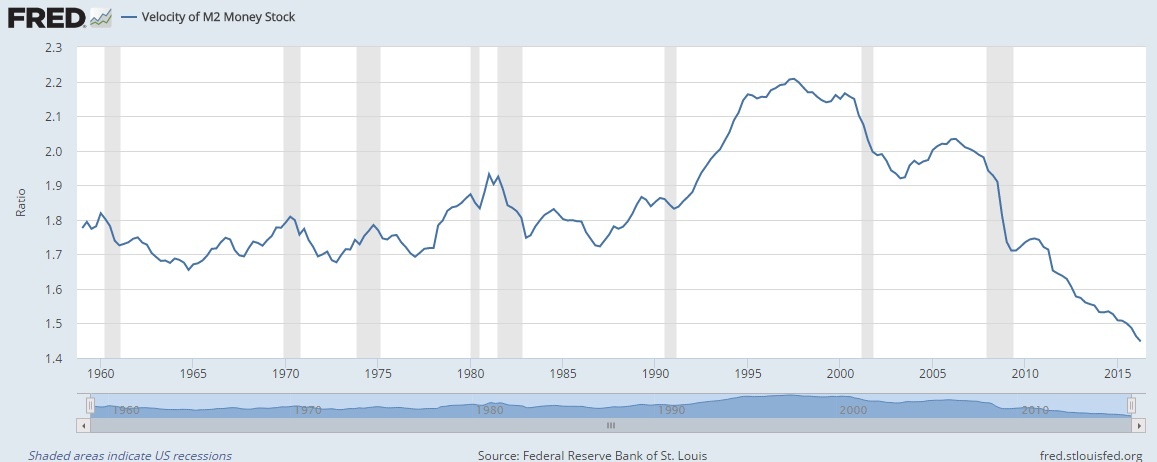
US Velocity of Money M2
There is just no sign of stopping this falling safe. I’ll believe in the hyper-inflation tooth fairy when this starts to turn up in a meaningful way.
Oil Prices
Rystad Energy just released an independent study that shows the US is considered to have more oil reserves than Saudi Arabia or Russia. This is the first time in history where the US has held this title. The study estimates the recoverable oil available in the U.S. at 264 billion barrels. Saudi Arabia has about 212 billion barrels and Russia has about 256 billion barrels.
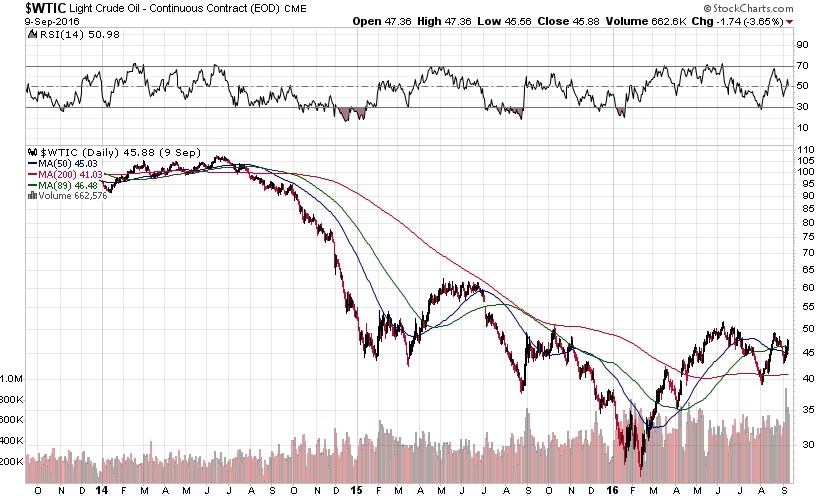
“We keep thinking that lower energy prices are somehow good for the economy. That can’t be, because energy prices or commodity prices in general don’t drive economic growth. Economic growth drives commodity prices.”
~Stephen Schork
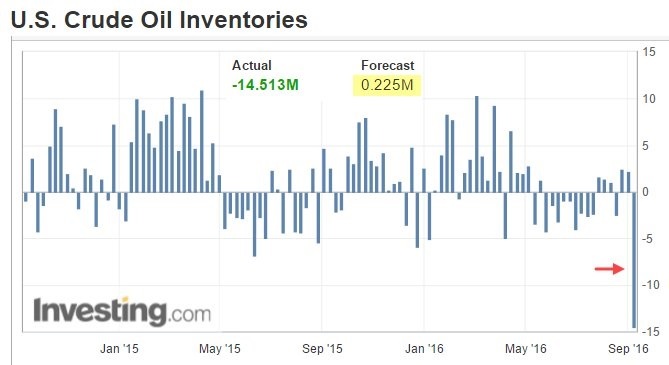
US Crude Oil Inventories
Massachusetts Gas Prices

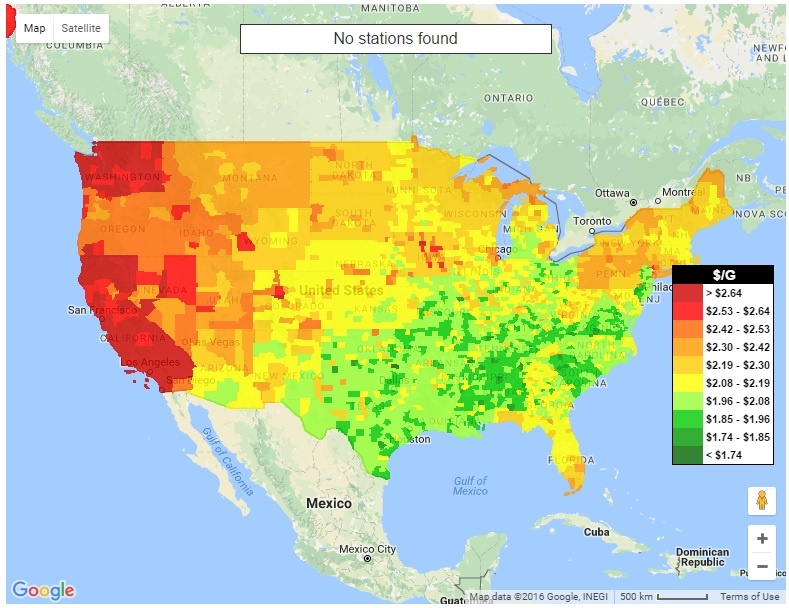
US Gas Prices
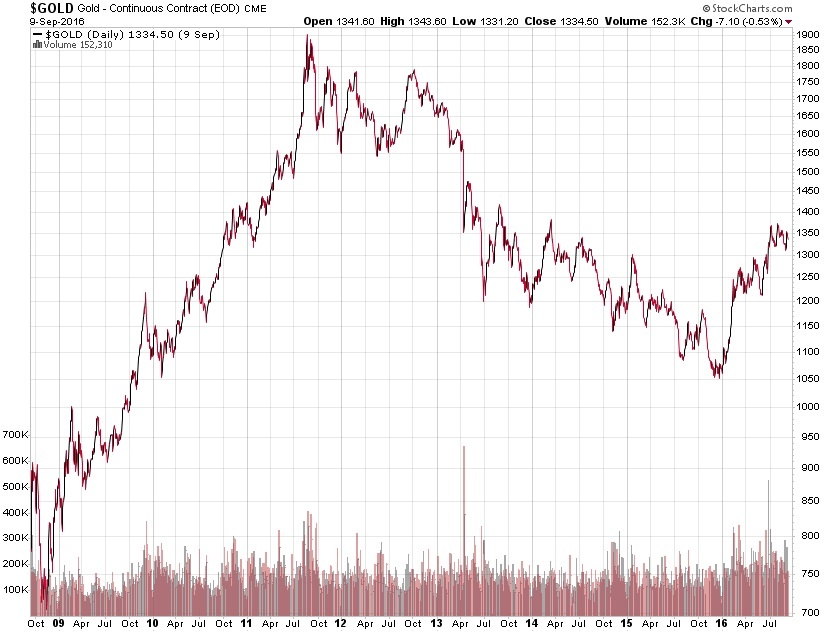
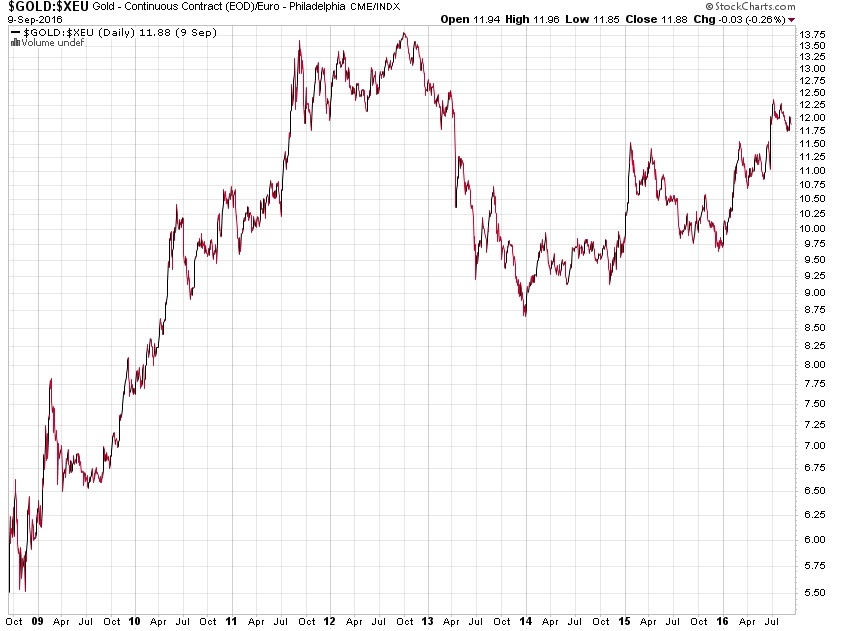
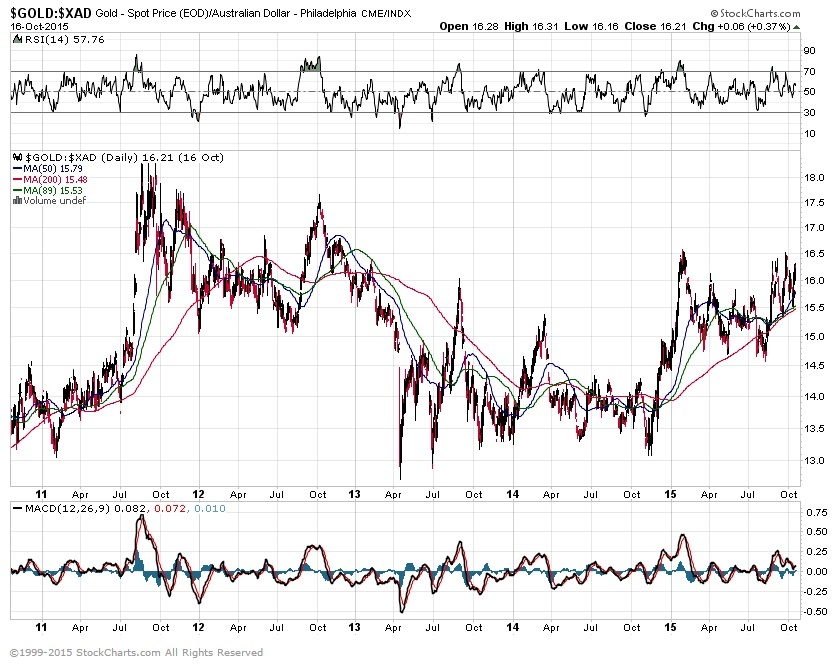
Currency Relative Valuations to Gold
Gold is priced in the currency you use every day. If you live in the European Union, you use Euros, if you live in Japan, you use Yen, and if you live in the US you use US dollars. Each of these currencies is used to buy gold in their respective countries, so we look at gold priced in each country to see how people value it in their own currency. This can tell us a lot about the demand for gold inside and outside the US.
Gold prices are they strong or weak?
The best way to look at any commodity, especially gold, is to compare the commodity to multiple currencies. If gold is rising or falling in US Dollars, that means nothing if the other currencies are not showing the same thing. A true bullish trend in gold is when gold is rising in all (or at least most currencies).
Gold is still in a bull trend.
Gold Priced in Euros
Gold Priced in Yen

Gold Priced in Canadian Dollars

Gold Priced in Australian Dollars

Bonds
TED Spread
A surge in the Ted Spread means a lack of trust in financial institutions. Currently, the Ted Spread is on the high side. It is far from the 2008 highs of 4.6, but the upward trend is not a good sign since it is confirming many other indicators.

10 year vs. 2 year Treasury Spread
The flattening (or inverting) of the yield curve is not good for banks and also typically shows signs on a recession. It is probably one of the best indicators of a recession we have, yet no one knows the status of whether this indicator still works since interest rates are stuck at zero… sorry 0.25% – 0.50%. What happens if the US has negative interest rates? what will the curve look like then?

Treasury vs Corp Bond Spread
The spread between 30-year treasuries and corporate bonds is climbing, as it can be in times of market distress. It will be interesting to see how this plays out as interest rates start to rise… assuming they ever do. Most markets have shown some relief from the risk off pressures earlier this year, but this number is still rising.

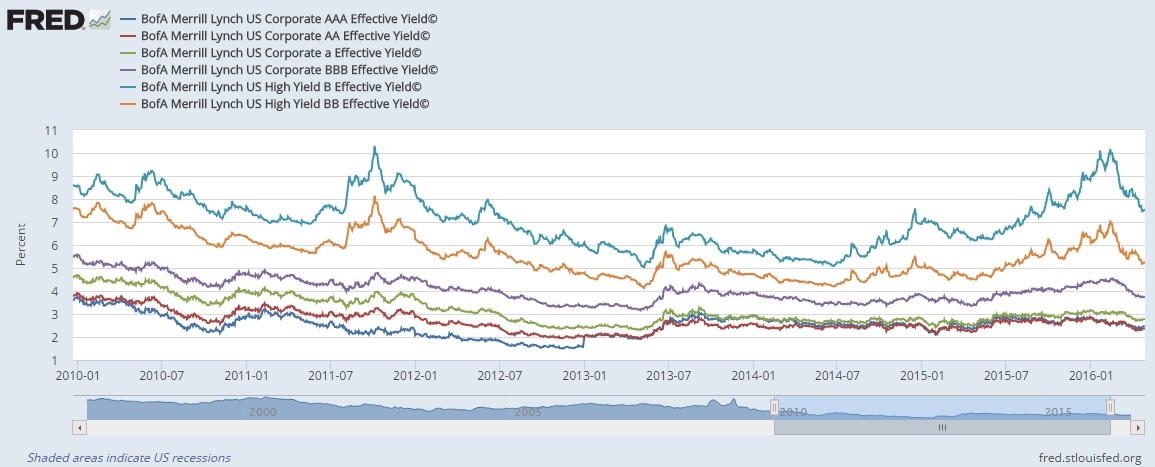
High Yield Bonds (Junk Bonds)
High yield bonds have had a good run of very low default rates. 2014 was around 1%. During recessions, these default rates tend to climb up to around 10% (1991, 2001, 2002, and 2009). This is fine unless you are getting 5% on your high yield bond income. In that case, you would net -5% a year. I’ll bet that is not quite what you had in mind when you were looking for income.
The end of 2015 and early 2016 went through a tumultuous period of time in the high yield bond market. 3 high-yield funds closed their doors in a matter of 3 days due to investors pulling their money out. You can read about this turmoil and the blueprint for financial contagion in my 2015 year end recap.
While the rebound in high yield bonds seems to suggest the worst is over, the “bad” bonds have not yet cleared. Unless oil prices continue to shoot back to $100/ barrel, I would suggest that there is still more bad news to come from the oil sector.
I think I am going to bring back “WTF” into my lexicon. HYG has broken out to all-time highs. Pair this with increasing default rates of high yield bonds, and you end up with disaster… eventually. Many high yield bond experts suggest that the high yield bond market is “frothy”. I think that is an understatement.

This shows the price of 30-year treasuries vs high yield bonds. A higher spread means the market is seeing more risk. lower spread means the market is seeing less risk.

Bond Yield Spread
High Yield Bond Spread
The high yield bond market is continuing to cool down. This is a good sign for the overall market.

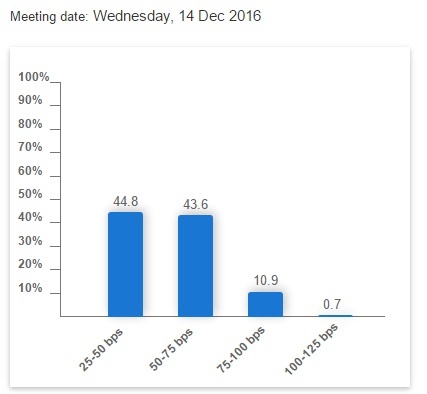
The probability of a Fed rate hike is still in the cards this year.
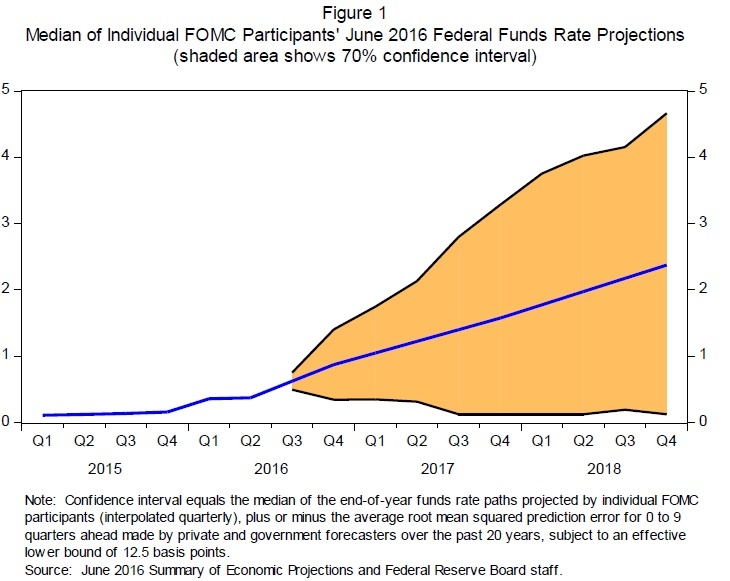
Fed Rate Projections
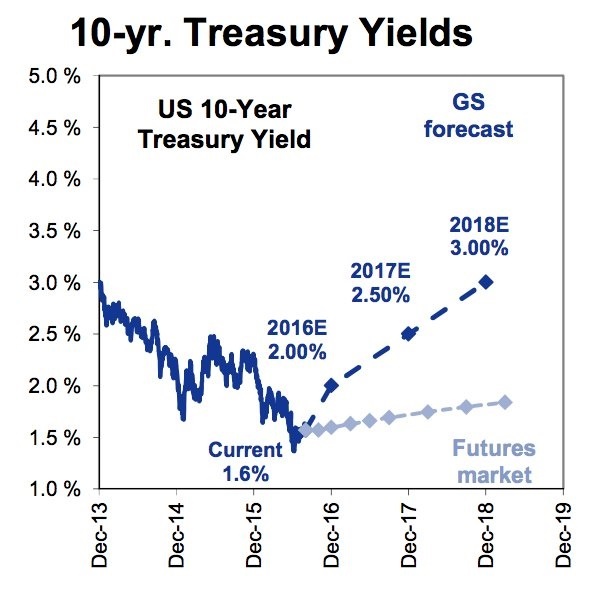
Goldman Sachs 10 yr treasury yield projections
Goldman Sachs Fed Funds Rate Target
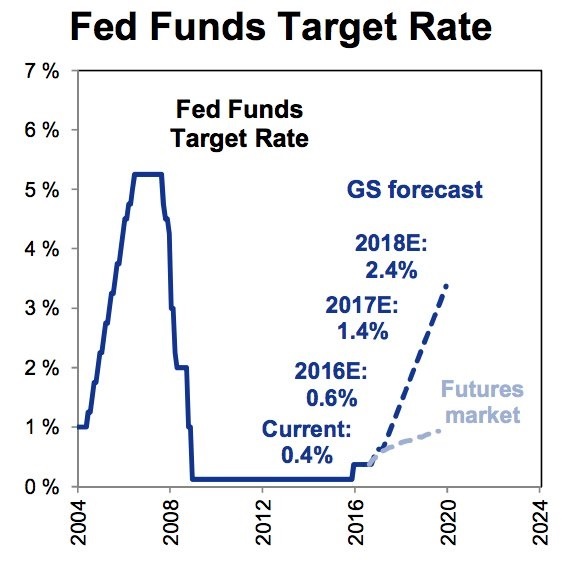
I think Goldman Sachs is getting ahead of themselves… or maybe this is a way for the Fed to get inflation… their secret tool (and what all financial markets are based on) the “expectation” of future events. If the market expects inflation in the future, this in essence, causes inflation (to an extent). I’m sure the “Chinese wall” put up between the revolving door of the US Treasury and Goldman Sachs makes sure that doesn’t happen… but it makes you wonder. </end sarcasm>
EU citizens living abroad

I found this to be an interesting look at how the EU is able to move its citizens between countries with ease. It is interesting that the UK has the largest number.
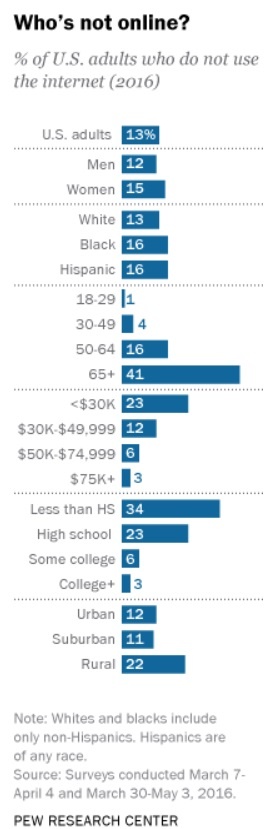
What Percentage of US Adults are not online?
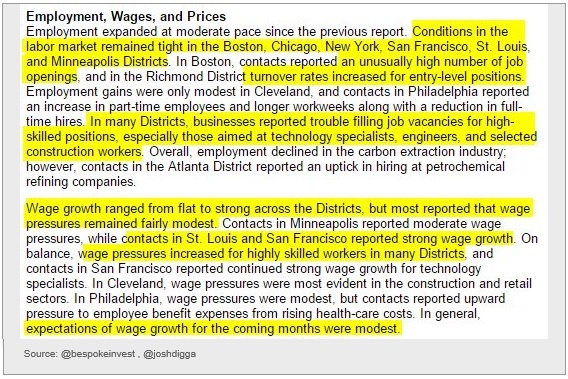
Employment Wages and Prices from the Fed’s Beige Book
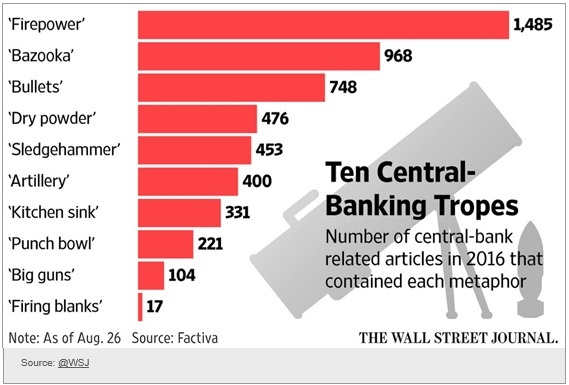
How is the media characterizing the Fed?
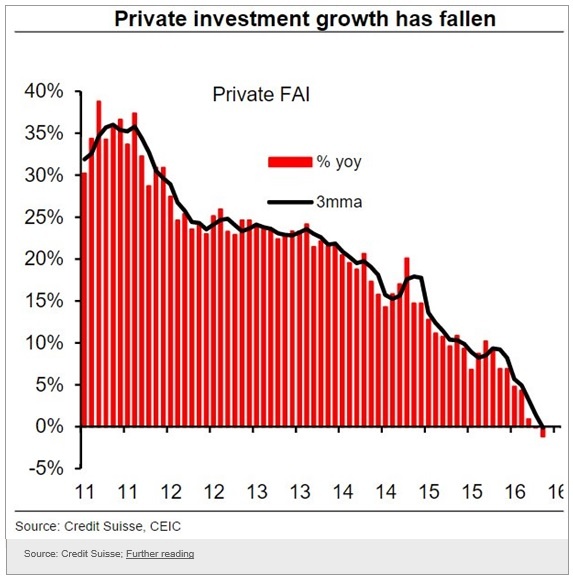
China’s Private investment is continuing to fall
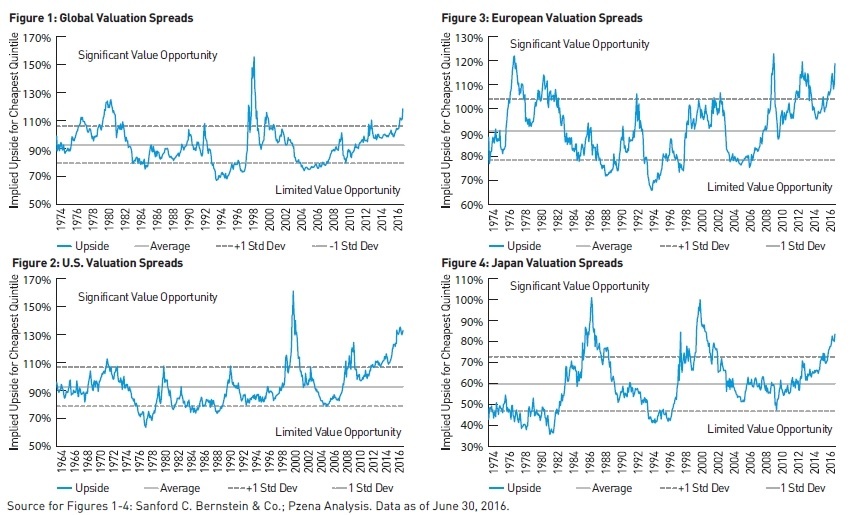
Global valuation spreads
What salary is needed to live in the following areas?
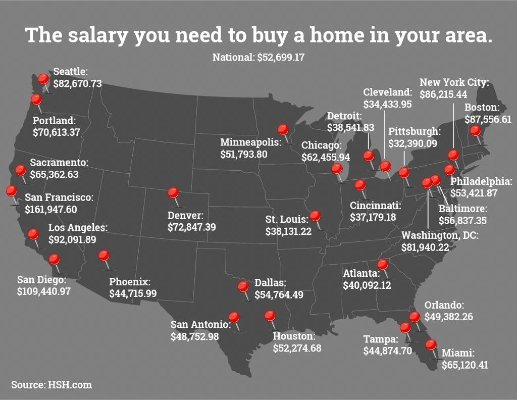
That is a BIG WOW for San Francisco. $162k.
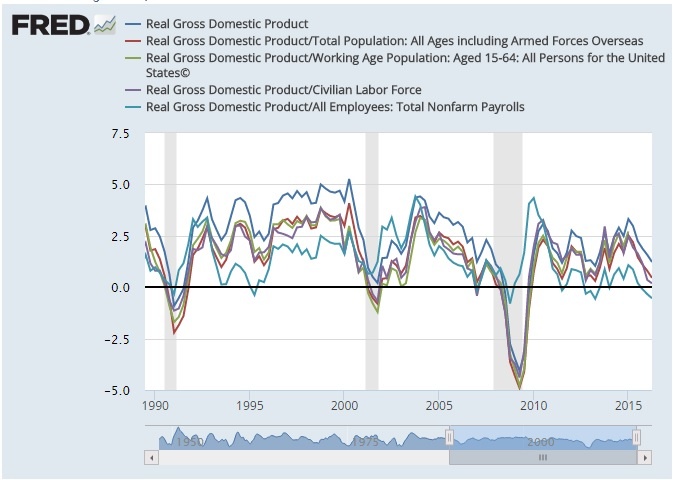
Real GDP separated up into parts
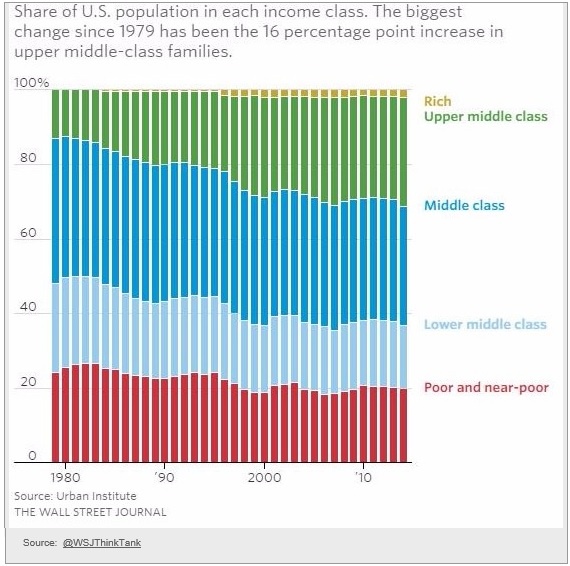
US Population separated into classes
Yellen Redux
I wonder if she is still worried? considering the extremely low volatility which has existed in the stock market despite the upcoming election. There is something beyond broken if this election season does not cause huge volatility in the markets.
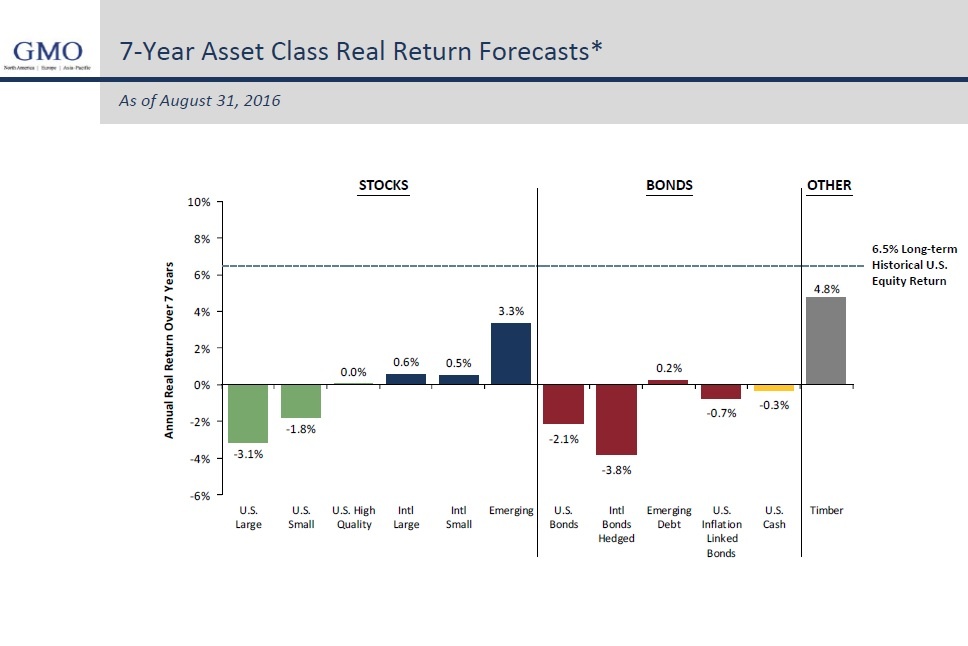
Asset Class Forecast
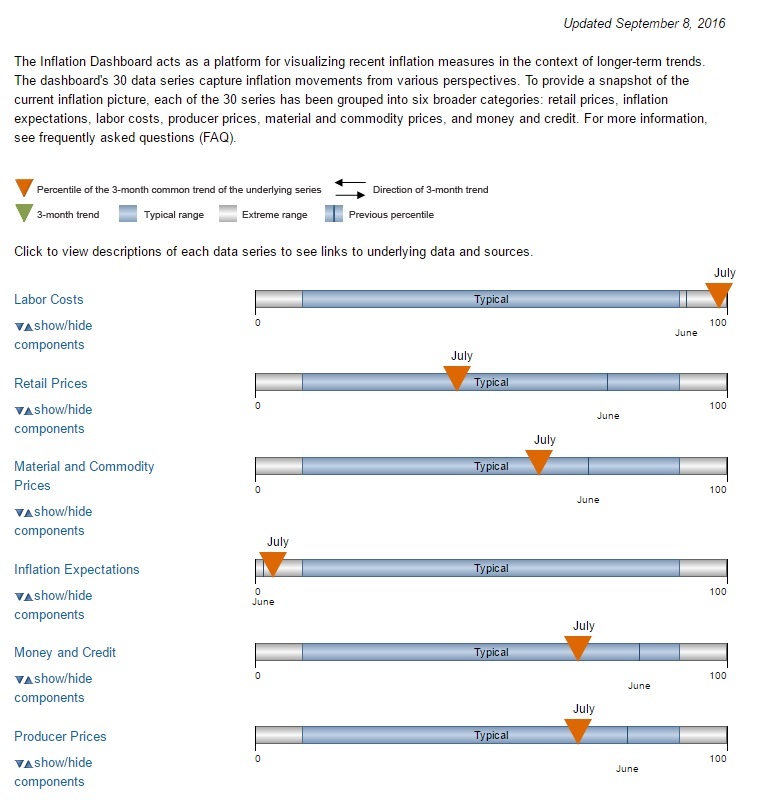
Inflation Dashboard
I like this view from the Federal Reserve because it gives more of a visual perspective of the data presented above.
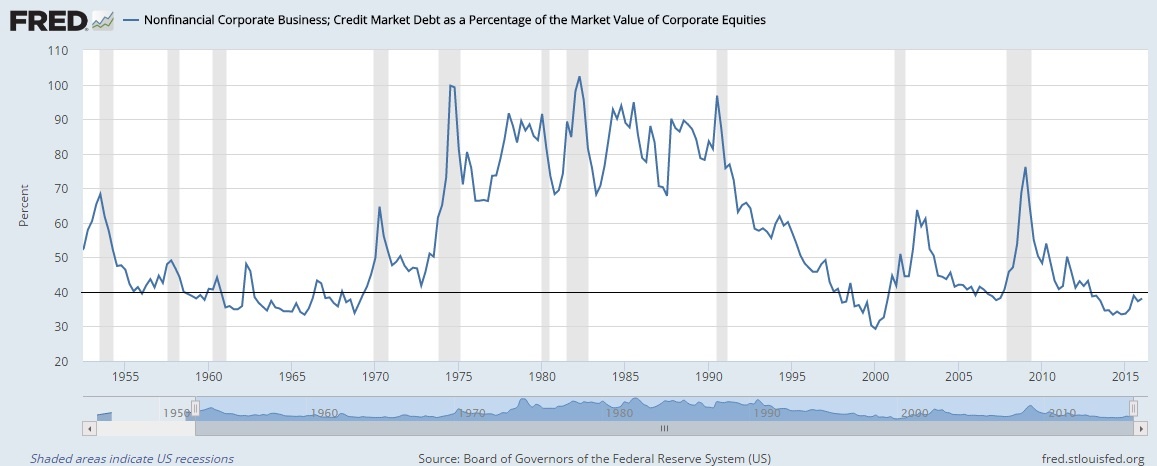
Corporate Debt as a Percentage of Equity
Anything below 40 is when it is dangerous to own stocks.
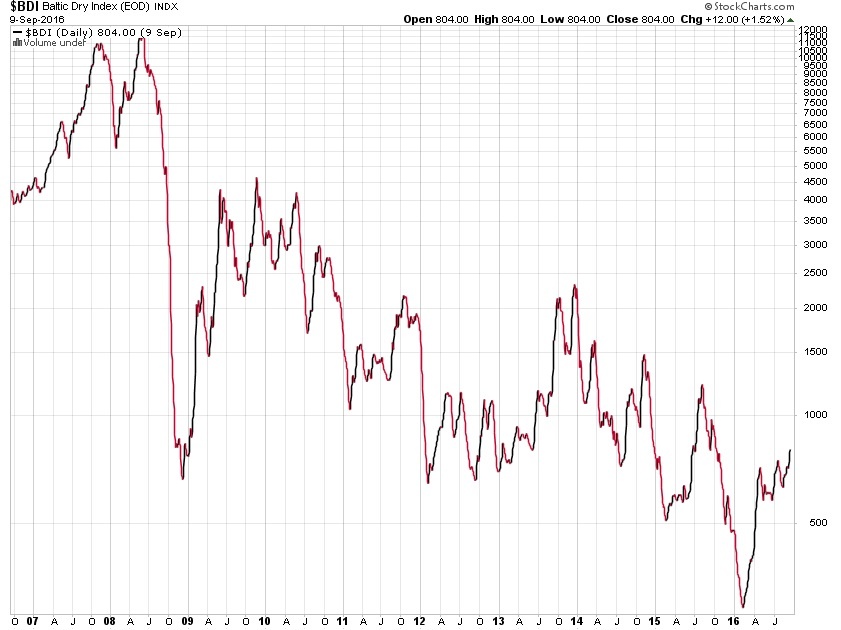
Baltic Dry Index
After breaking below the index all-time lows late last year, it has rebounded since then. It could be the rise in oil prices, or just that the index can only go so low, where any increase in activity would push it up. While this indicator is not all that important, it is just another piece of information that the global economy is not doing well. Until we see a sustained pickup in dry shipping, the global economy is still not strong.
I hope you enjoyed this month’s Inflation Monitor. See you next month.
Cheers,
![]()
Kirk Chisholm
The IAG Inflation Monitor – Subscription Service
We have been publishing this Inflation Monitor as a free service to anyone who wishes to read it. We do not always expect this to be the case. We expect to charge a small fee for this service starting in 2017. The high amount of interest in this service has put constraints on us to provide more, so this small fee should cover our costs for providing this excellent resource. Our commitment to our wealth management clients is to always provide complimentary access to this research. If you would like to discuss becoming a wealth management client, feel free to contact us.
If you would like to automatically receive the Inflation Monitor in your email inbox each month, click here to join our subscription service.
![]()
Sources:
- Federal Reserve – St. Louis
- U.S. Energy Information Administration
- TD Ameritrade
- National Association of Realtors
- The Economist
- The Commodity Research Bureau
- Gurufocus.com
- Stockcharts.com
- GasBuddy
* IAG index calculations are based on publicly available information.
** IAG Price Composite indexes are based on publicly available information.
About Innovative Advisory Group: Innovative Advisory Group, LLC (IAG), an independent Registered Investment Advisory Firm, is bringing innovation to the wealth management industry by combining both traditional and alternative investments. IAG is unique in that we have an extensive understanding of the regulatory and financial considerations involved with self-directed IRAs and other retirement accounts. Innovative Advisory Group advises clients on traditional investments, such as stocks, bonds, and mutual funds, as well as advising clients on alternative investments. IAG has a value-oriented approach to investing, which integrates specialized investment experience with extensive resources.
For more information, you can visit: innovativewealth.com
About the author: Kirk Chisholm is a Wealth Manager and Principal at Innovative Advisory Group. His roles at IAG are co-chair of the Investment Committee and Head of the Traditional Investment Risk Management Group. His background and areas of focus are portfolio management and investment analysis in both the traditional and non-traditional investment markets. He received a BA degree in Economics from Trinity College in Hartford, CT.
Disclaimer: This article is intended solely for informational purposes only, and in no manner intended to solicit any product or service. The opinions in this article are exclusively of the author(s) and may or may not reflect all those who are employed, either directly or indirectly or affiliated with Innovative Advisory Group, LLC.