
Inflation Monitor Summary – Composite Ranking

The Inflation Monitor is a monthly report that tracks inflation trends. We do this by monitoring various economic indicators, asset prices, and goods and services. The purpose of the Inflation Monitor is to provide more clarity to the CPI number for the average investor.
We summarize the Inflation Monitor statistical data into the Inflation Monitor Equilibrium. This equilibrium summary was devised to help investors understand the impact of economic statistics and what areas of the economy are providing inflationary pressures and which are providing deflationary pressures.
The numbers on this summary are a rating score of the amount of inflation or deflation that exists in a segment of the economy. 10 is the highest score possible to indication high inflation. 1 is the lowest score indicating high amounts of deflation. The brown line indicates the average number of all 9 components of the economy.
Inflation Monitor – October 2016 – Introduction
Happy October! We are in the heat of the presidential election cycle which thankfully will end in early November. We have the two least liked candidates fighting for control over the POTUS position. We have already had three debates… If you could call it that. After watching the first debate, this is how I felt. Before you jump to think I am referring to one of the candidates or the other, I am referring to both. I am guessing that we have the lowest voter turnout in decades… assuming you don’t include the dead people who end up voting.
On to brighter topics… Deutsche Bank has been in real trouble lately. The kind of trouble that Bear Stearns, Lehman Brothers, and many other US financial institutions were in in 2008. High leverage, holding bonds of questionable quality, and institutional investors starting to pull their money and run for the doors. If you are familiar with the concept of yelling fire in the theater, a bank run is very similar. If a few people run for the door, the situation is manageable, but if everyone runs for the door at the same time, they will not be able to get out. Right now some investors are pulling their money out, but if everyone does it at the same time, we could have another global financial crisis starting in Europe. The epicenter is starting Germany of all places.

If you have not been following the European mess, many of the European banks never truly recovered from the global debt crisis. Despite the poor shape of the European banks, they have plugged along until now. Germany’s economy is probably the strongest economy in the European Union (EU). If their #1 bank (Deutsche Bank) and second biggest lender (Commerzbank) experience a run, the whole of Europe will have problems. I am not prone to hyperbole, but this is the second time a truly scary event has happened in the last 12 months. If you missed the first it was at the end of December when 3 high yield bond funds closed their doors to investor redemptions in 3 days. Thankfully, it didn’t get worse.
I’m sure the ECB and central banks around the world are aware of what is going on (I hope), and I’m sure they “will do whatever it takes” to keep this from spreading. Angela Merkel has stated recently that she will not bailout the Deutsche Bank… which in politician speak means she will. Logic dictates that she will have to in order to keep the problems from spreading.
To put a number to the problem, Deutsche Bank has 2.9% net equity. This means that if they sustain 2.9% losses, then they will effectively be insolvent. To put this in simpler terms if you own your home and it is worth $100,000 and you put down $2,900 to purchase that home, then you have 2.9% equity in your house. If the value of your house drops more than 2.9%, you will be underwater and will owe more than the house is worth. The International Monetary Fund (IMF) has recently stated, “Deutsche Bank is the most important net contributor to (global) systemic risks.” and that they are the riskiest financial institution in the world.
Recently, it was reported that John Cryan told his staff in a memo, “The bank’s balance sheet is safer than at any point in the past two decades… Trust is the foundation of banking. Some forces in the markets are currently trying to damage that trust.” From January 2014, Deutsche Bank was trading at a high of $52.27 per share. Today it is trading at $13.09. That is a drop of about 75% in less than 3 years. Does that stock performance sound like something that would indicate the bank’s balance sheet being “safer than at any point in the past two decades”?
What force could be strong enough to damage that trust??? Let me take a guess and say — Truth
Speaking of Truth… Did you catch the senate hearings with John Stumpf? It is being claimed that Wells Fargo has opened as many as 1.5 million bank accounts and 565,000 credit cards that may not have been approved by customers. WTF. Really???
If you think this is a crime and should involve jail time. I would agree, but let me bring you back to reality and take a guess at the outcome (based on historical precedence). Wells Fargo will get fined around 10% or less of the profits they made off of this fraud. No one of significance will go to jail over this (maybe some low-level teller who cannot afford a good attorney), and everyone will forget about this since the fines will happen 1-2 years from now. Sure its a crime that this happened, but the real crime is that the incentives are so skewed that the banks are incentivized to continue this type of behavior. If we really want to stop this type of behavior, then the punishment needs to fit the crime. Make the penalty or fine at least 2-5x the profits made from the fraud.
If you think we need new laws to stop this behavior, we don’t. We have enough laws. We just need to enforce the laws we have.
But I digress…
Just to wrap up this part before moving on to more happy news, the problem with any large financial institution is not that it will fail. The problem is that each large financial institution has counterparty risk with other financial institutions. So if one fails, then who will back the guarantees that were made by that institution? This could cause losses at other institutions that trade with Deutsche Bank. This is what we call contagion. This is what happened in 2008 with Bear Stearns and Lehman Brothers. The financial system is based on trust. Once that trust is eroded, the system implodes. One of the signals we watch for is the TED spread (see below).
On to other news.
The profit recession continues in the S&P 500. I would not be at all surprised that you have not heard this news. Apparently, the stock market doesn’t care because it continues higher. I guess profits don’t matter anymore. I have been predicting that the US economy would experience a recession in the 2nd half of 2016. It appears as if it is happening if you base it on the growth of earnings. However, from a stock price perspective, it hasn’t happened yet. However, recessions are determined in hindsight, so we won’t know until much later. Here is a quote from an article in the Wall Street Journal,
“Companies in the S&P 500 are now expected to report an earnings decline for the sixth consecutive quarter in the coming weeks, according to analysts polled by FactSet. That slump would be the longest since FactSet began tracking the data in 2008. The prolonged contraction has raised questions about how far stocks can rise without corresponding strengthening in corporate earnings.”
Questions from readers:
A subscriber recently said to me, “You need to look for more opportunities in the markets instead of all the negatives.”
I would like to address that comment here because I think it is an important insight into the markets.
As an investor and wealth manager, I focus on risk management first. When I look at any investment, I look at the risks first. If I am comfortable with those risks, then I explore the potential for returns. I’ll quote Warren Buffett here as support for my view,
” Rule #1 is don’t lose money. Rule #2 is make sure you follow rule #1.”
In the period from 2007 to 2009 the S&P 500 lost over 50% of its value. This means you would have to make 100% just to get back to where you started from. Do you want to be in a hole of losing 50% of your retirement nest egg just as you are entering retirement?
There are always opportunities in every market, even in terrible markets such as 2008. The problem is that in some markets it is really easy to lose money. Sometimes, it is best to just sit and wait for the “fat pitch” or easy trade.
What I have found over the years is that time may be your biggest enemy. Not in the way that you think. Most people think that inflation is the enemy and that the time value of money is it’s cousin. I have found this is not the case for the past 17 years. If you are worried about losing opportunity today and that you might miss the 5% upside on the S&P 500, then you need some perspective. The period from 2000 to 2013 the S&P 500 lost -0.35% annually. Yes, that’s right, your average annual return was -0.35%. So if you had kept your money in a money market fund for 14 years, you would have outperformed the S&P 500 for 14 years.
So are you still worried about your lost opportunities?
Jim Rogers once said his favorite investment strategy is to wait till there is a pile of money in the corner of the room, then he just goes over and picks it up. Meaning that he waits for the easy trade. A no-brainer type of investment. You should consider the same type of strategy. Most investors feel like they need to “do something” with their capital. This tends to cause people to make mistakes with their investments.
The next question that I think is worth addressing is:
“I would like to see more info on the fact since all other countries are moving to negative interest rates, what the likelihood USA will do this too…or research USA’s special circumstances that would make USA immune from having to go negative”
This is a good question. I will try to find the appropriate data on this is possible. Here is the problem. Negative interest rates are an aberration. I don’t believe there is any data to suggest anything based on historical precedent. We are in new territory.
Here is my theory on negative interest rates. The US is not different or special. The Federal Reserve ( a central bank of the US) determines the monetary policy. Central banks around the world do the same for their country. Most of them think alike because they use similar theories about how the monetary system works. Thus their solutions to problems end up being similar as well.
Negative interest rates are an experimentation which is playing out around the world. Central bankers seem to be pleased with the outcome and the Fed has suggested that they have discussed the idea and have considered it. I believe that if the US experiences an economic crisis in the next few years with interest rates at all-time lows, we will have negative interest rates here. The results will be disastrous. Banks, insurance companies, and pension funds cannot survive in that type of environment. The US has a stronger economy than many developed countries around the world, but we are not immune to recessions.
“Yes, a specific list of asset classes that benefit or get hurt most by either: lower or higher interest rates, lower or higher inflation, etc etc….very helpful if you could offer guidance on this…and name equity funds or ETF’s that would be best for each scenario”
I plan on writing about this topic in a post, but I’ll give you the brief summary. Rising interest rates hurt bond prices and interest rate sensitive stocks (like REITs, MLPs, and dividend stocks). Falling interest rates benefits bonds and interest rate sensitive stocks. This is primarily due to the spread over the risk-free rate of return investors receive from Treasuries.
The question investors would naturally ask is that if you can invest in “risk-free” treasuries at 1% then you should want more than 1% income to invest in an asset that has a higher risk. If high yield bonds are yielding 5% then the spread is 4%. 4% is what you are getting paid for taking more risk. You have to determine whether this is suitable for you.
I will not give names of individual securities as recommendations. We save that type of advice for our clients. I hope you found this helpful.
One last point I think is important to think about.
The Social Security COLA rose 0.30% this month. Last year it didn’t rise at all. What does this mean? Either inflation was zero last year and only 0.30% this year… or the government does not want to raise the COLA as a way to save money. I’ll let you decide which is the answer. In case you were wondering, the CPI for the past 12 months was 1.46%.” So inflation exceeded the COLA by 1.16%, or you have lost 1.16% of purchasing power for your Social Security.
If you want to send me your questions, you can email them here:
I hope you enjoy this month’s Inflation Monitor – October 2016.
Kirk Chisholm
![]()
Reference Pages:
- Historical Inflation Rates
- Inflation – The Secret To Building Wealth In Real Estate
- Deflation – How a Mortgage Can Destroy Your Real Estate Wealth
Quotes of the Month
“Debt is future consumption brought forward. Once debt is incurred, consumption that might have happened in the future won’t happen, and it should come as absolutely no theoretical surprise that at a certain level of debt, growth and income begin to diminish. That is exactly what we are seeing in the real world, even if those who espouse the reigning economic paradigm (Keynesianism) are still in love with their beautiful theory.”
Charts of the Month
Interesting Inflation Charts
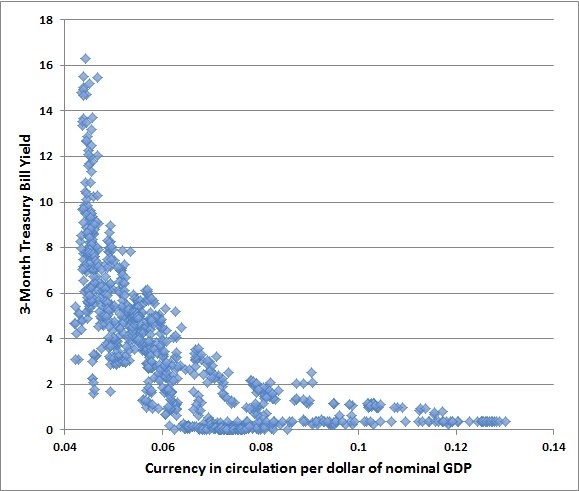
I think I am going to make this chart a permanent part of this inflation monitor so that the importance of it is not missed. John Hussman put this chart in one of his weekly reports a while ago. If I could find the report, I would link to it. You should definitely read his weekly reports. It was a great report about how interest rates relate to the amount of money in circulation. The basic idea is that as rates climb higher, there is less money in circulation, and when rates are low as they are today, there can be an enormous amount of money in circulation without causing high inflation. This idea is a basic concept in economics, however, what is most interesting is seeing this visually.
Think of it this way, if hypothetically the US government can support a debt of $100 at a 5% rate of interest ($5 a year), then how much can the US support at 0.05%? $10,000 or a 100x increase. If rates are at zero, then the number becomes infinite. Now, what if interest rates are negative, why wouldn’t the US print an infinite amount of money?
Obviously, this is hypothetical, but it is important to understand this principal. Once you do, then this is the important part you don’t want to miss. Look at the slope of the curve in this chart. While you may be able to exponentially increase the supply of money without increasing your debt service, the hard part is when you try to increase rates. You will learn very quickly that the debt is unsustainable. If you want to see why interest rates will not rise quickly around the world, this is it. Once you have created $10,000 in debt you will have to reduce it by 99% to reach the 5% rate you had originally. What are the chances of this happening?
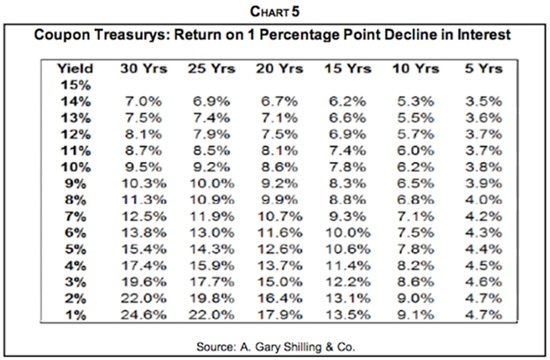
Interest Rate Sensitivity
I think this is one of the most important charts you will look at this month. Quite frankly you should know this inside and out if you have any money at all in bonds. I say this because we are at what could be the end of a historic bond bull market. Sure we could continue lower into negative interest rate territory, but let’s be serious for a moment. Do you think that will last?
Oddly enough, if you listen to the money mandarins of each country’s central bank, this is an experiment they are willing to try… because they have run out of ideas.
Here is a great quote from Bill Gross from his latest monthly letter
I and others however, have for several years now, suggested that the primary problem lies with zero/negative interest rates; that not only do they fail to provide an “easing cushion” should recession come knocking at the door, but they destroy capitalism’s business models – those dependent on a yield curve spread or an interest rate that permits a legitimate return on saving, as opposed to an incentive for spending.
They also keep zombie corporations alive and inhibit Schumpeter’s “creative destruction” which many argue is the hallmark of capitalism. Capitalism, almost commonsensically, cannot function well at the zero bound or with a minus sign as a yield. $11 trillion of negative yielding bonds are not assets – they are liabilities.
Factor that, Ms. Yellen into your asset price objective. You and your contemporaries have flipped $11 trillion from the left side to the right side of the global balance sheet. In the process, you have deferred long-term pain for the benefit of short-term gain and the hopes that your ancient model renormalizes the economy over the next few years.
It likely will not. Japan is the petri dish example for the past 15 years. Other developed market economies since Lehman/2009 are experiencing a similar fungus.
— Bill Gross, “How I Found My Golf Game But Lost My Wife to a Titleist.”
I think Bill Gross’ description of the global problem we face is very accurate and a look into the future. In case you are not familiar with what is happening in Japan — Deflation.
The Fed owns 35% of all US Treasuries longer than a 5-year maturity. Could we possibly make it easier for our politicians to spend our money? We create US Treasuries, the Federal Reserve buys them, and our elected officials spend the funds.This is money being created and spent by our politicians for whatever they want, not what we want (unless you are a “friend” of theirs). What makes it worse is that the politicians are getting used to this type of incentive structure. It will be hard to break them of this habit. It is essentially free money for them to do what they please. Call me crazy, but I think these funds would be better spent by the taxpayers. At least with the taxpayers, there is a free market approach to the funds going where they are needed.
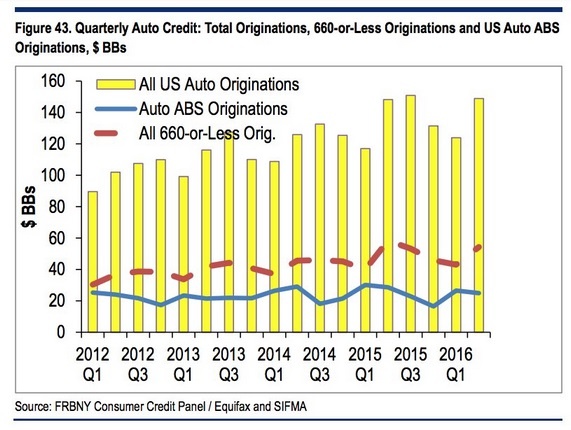
Charts I found interesting this past month
Looks like auto credit scores are declining as new loans increase. Could be a repeat of the housing crisis if low credit scores climb too much.
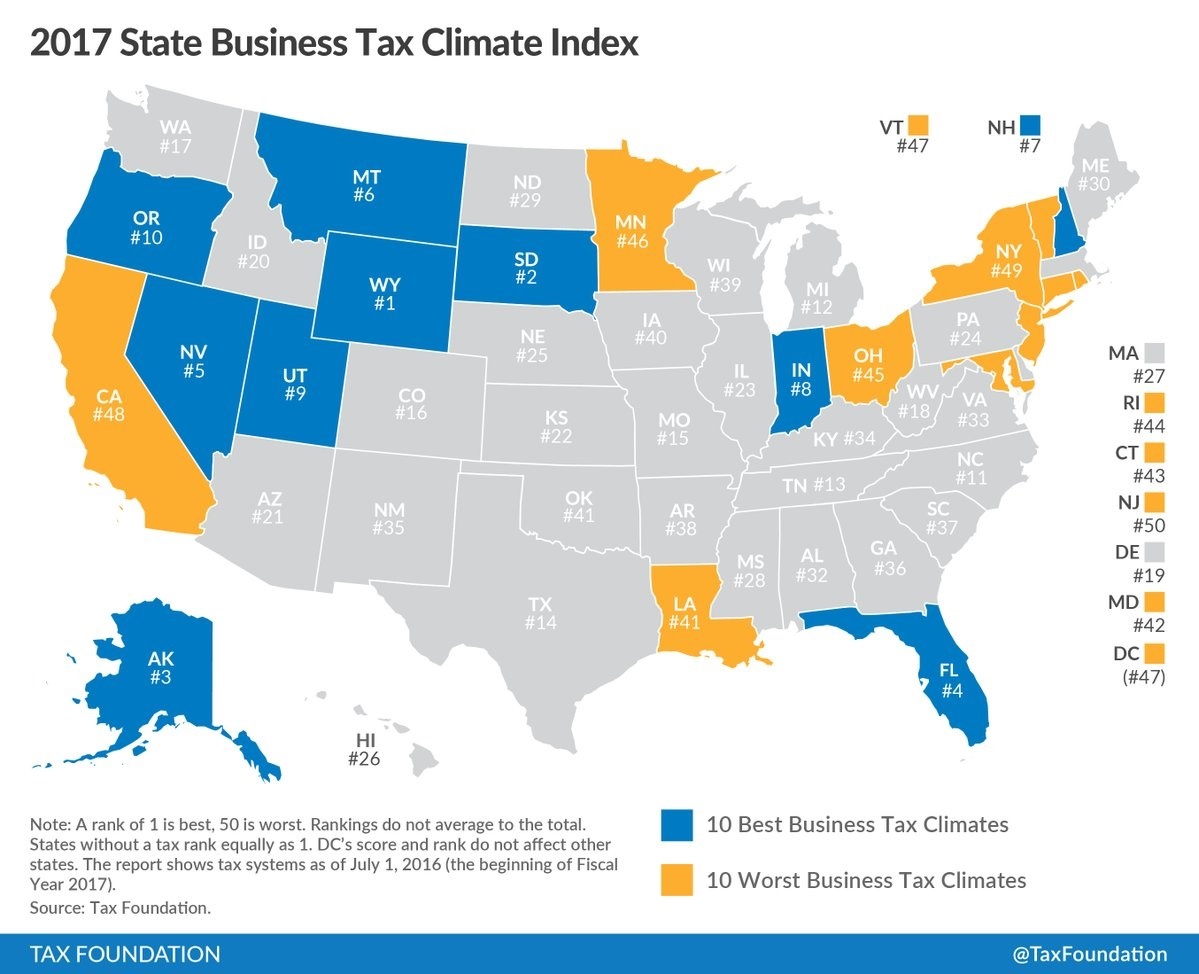
If you are looking to start up a business, consider the state business tax climate. States like NY, CA, DC, and NJ are not ideal places to start up a business.
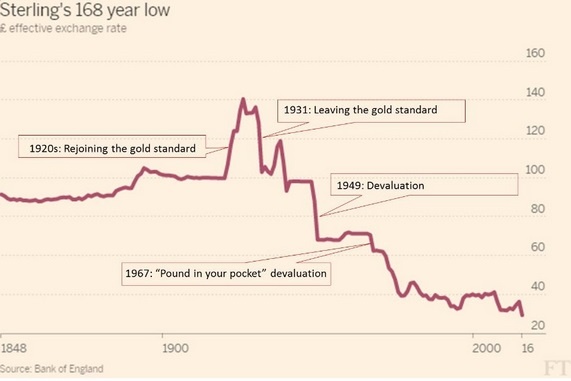
The Brexit has caused the British Pound to decline in value recently. Here is a bigger picture of the British Pound. It helps put the decline in perspective.
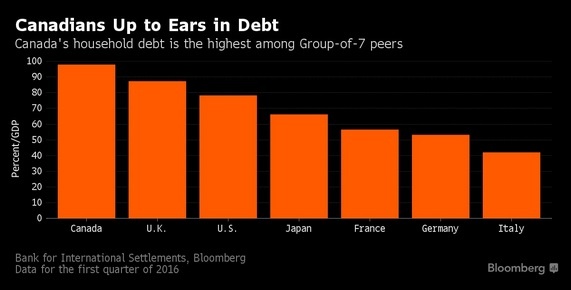
Households in Canada have the highest debt to GDP among its peers.
Canada has long been a country that accepts immigrants from around the world. here are the latest trends.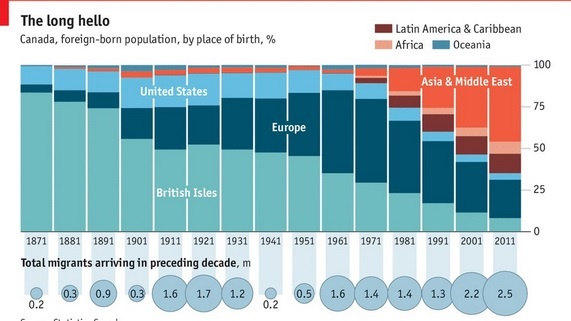
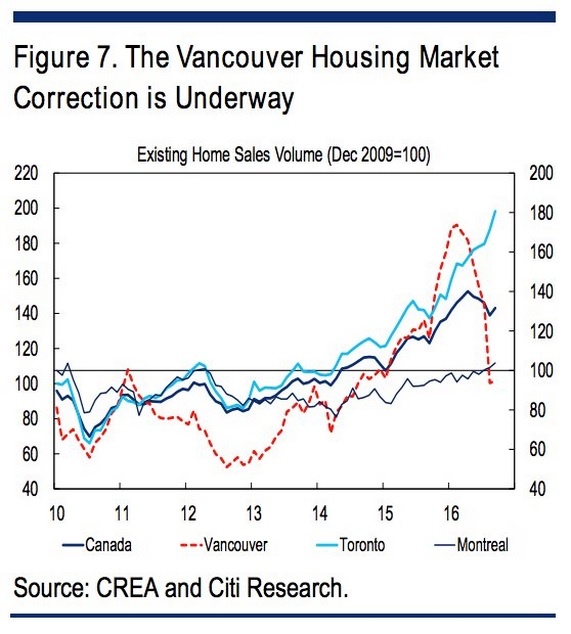
Vancouver real estate has been in a speculative bubble for a while. Now that bubble is popping.
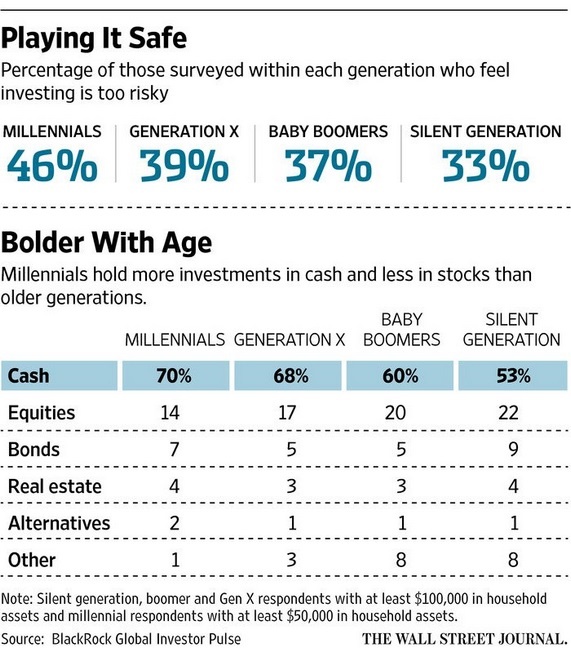
Here is a look at how different generations perceive investing
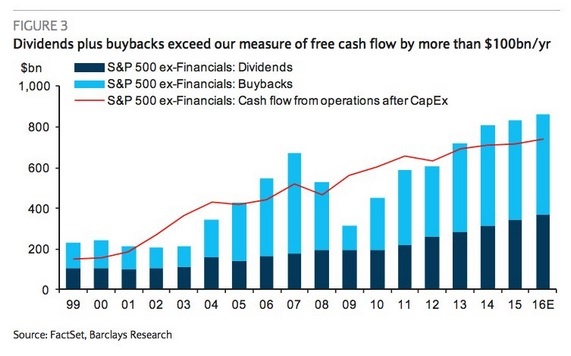
Companies are paying shareholders more than the company is making in free cash flow. This will not end well.
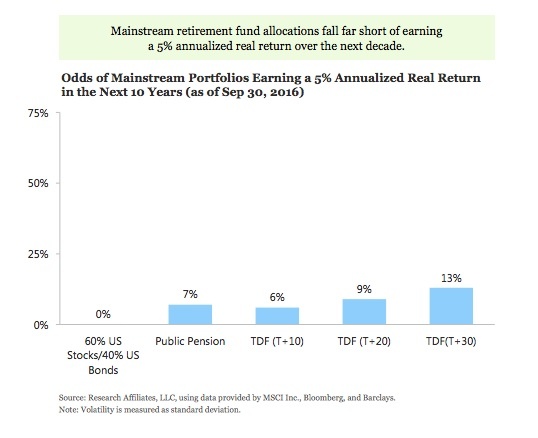
Are you considering a 60/40 portfolio? you might want to rethink that strategy.
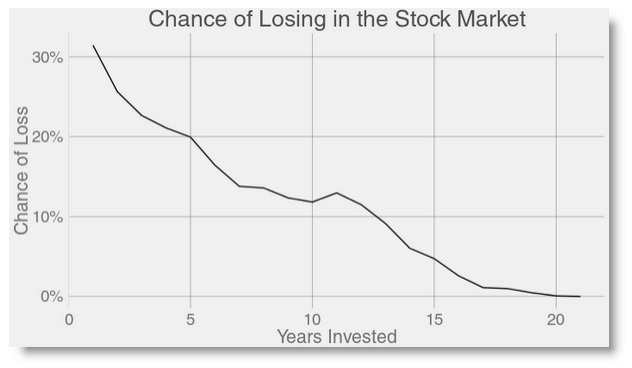
This is why buy and hold works. However, I think today’s odds are much different. See above image.
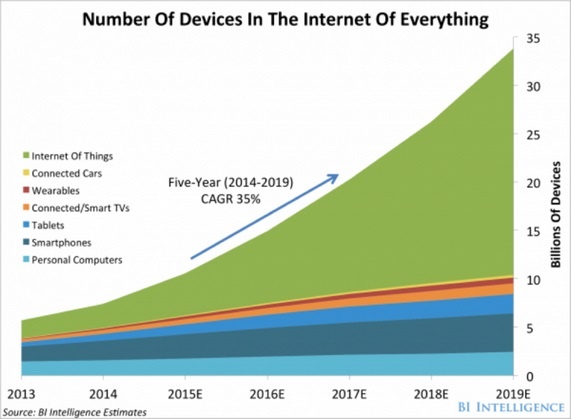
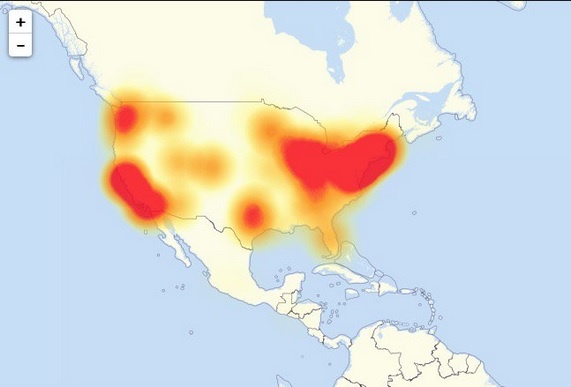
the internet of things is growing. This is also a problem as you may have noticed with the DDoS attack in late October.
Here is the DDOS attack heat map for affected areas.
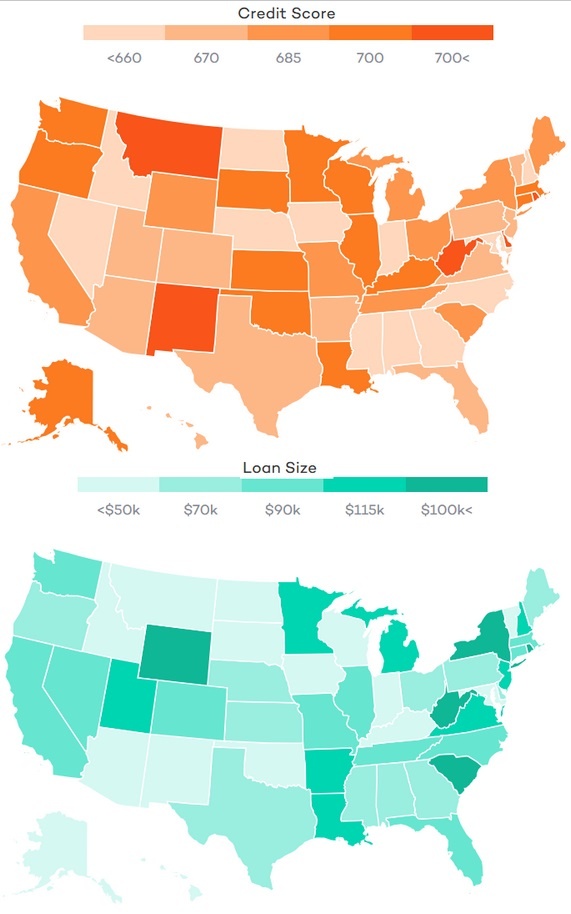
This heat map shows the average credit scores and loan sizes.
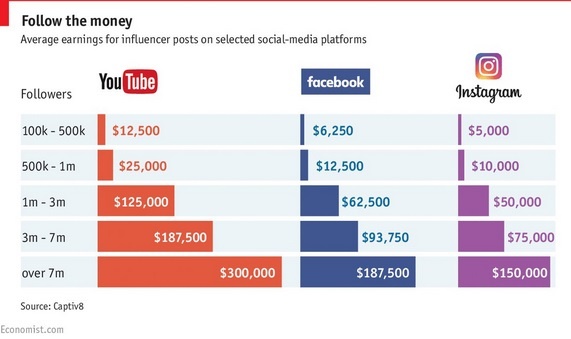
Looking to make millions as a social media influencer?
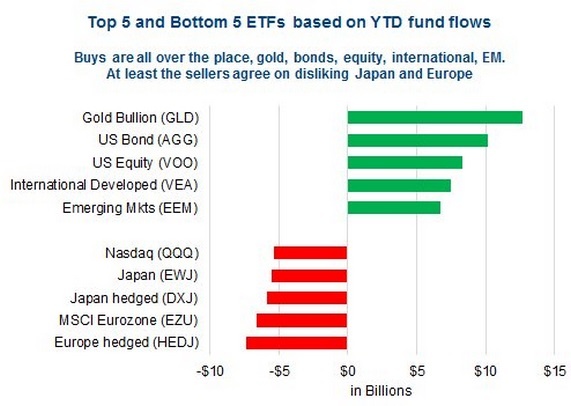
Investor ETF money flows.
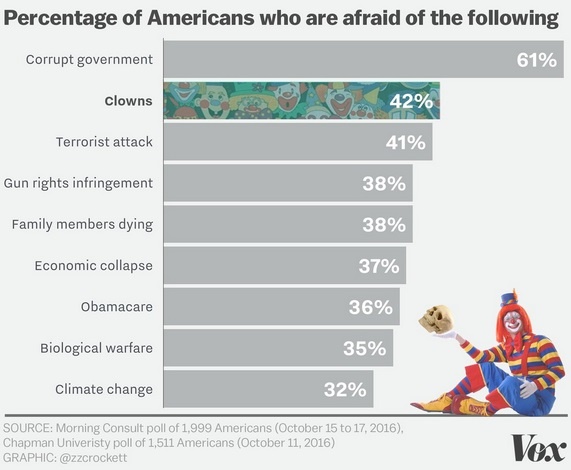
Clowns are making a comeback… although it might not surpass corrupt government.
Here is the same data excluding clowns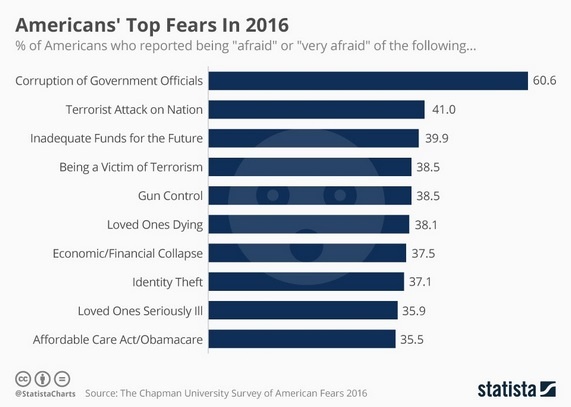
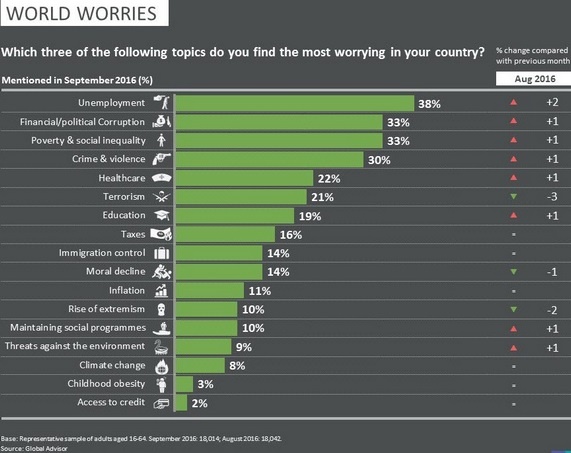
global fears
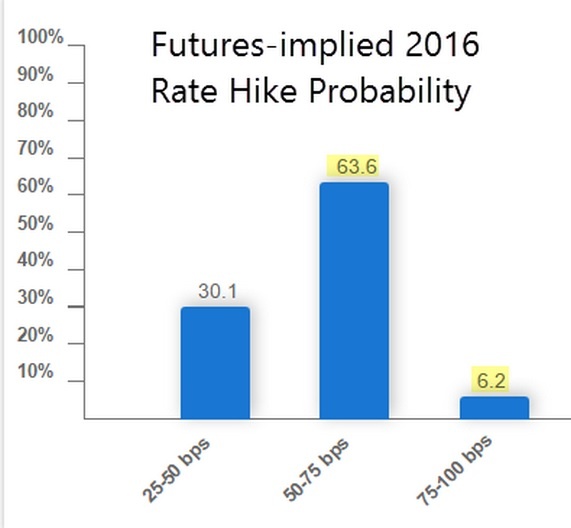
Probability of a Fed Rate Hike in December
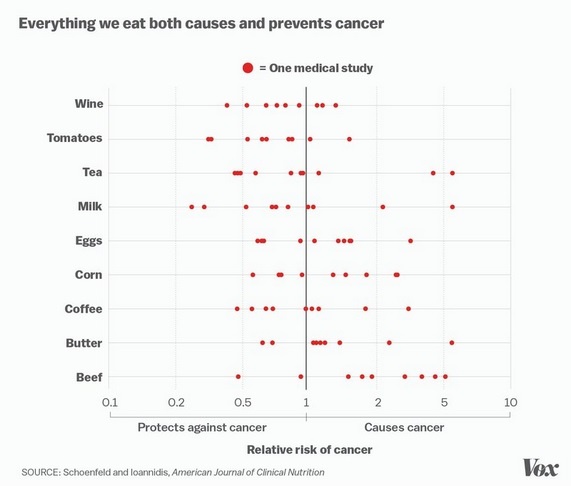
Is what you are eating curing or causing cancer… the science jury is still out.
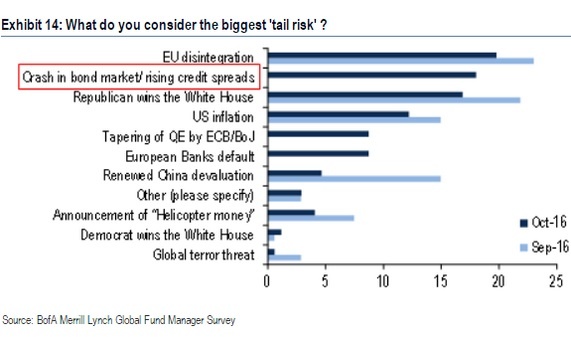
Back to fears… notice the red box? I completely agree although I think a lot fewer people are worried about this than should be.
Hey, why is the US not on this list… Oh, it says “efficient” health care.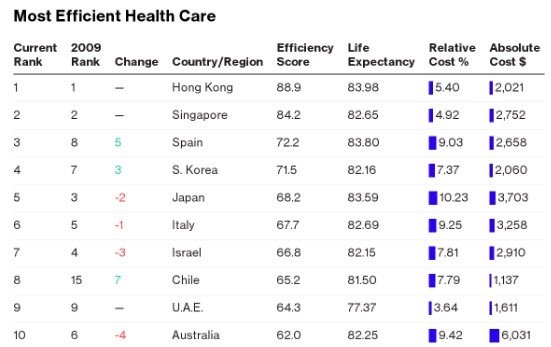
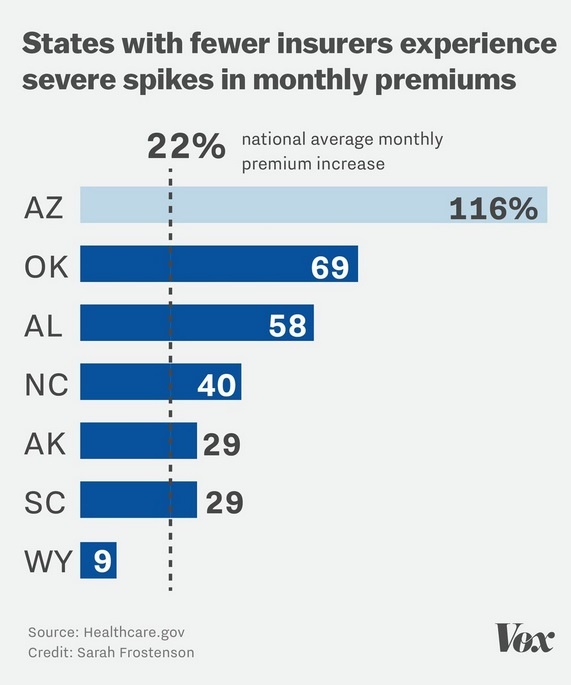
In case you don’t live in one of these states, you are in for a surprise this year when your health insurance renews.
No comments needed on this one.
simply put we as a nation cannot afford to buy a house. Not quite at 2005 levels, but not exactly affordable either.
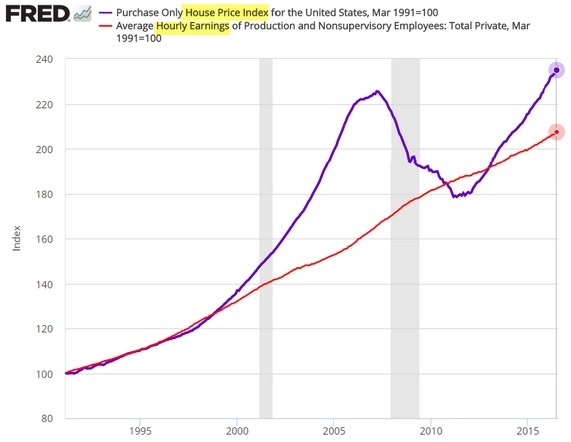
Another look.
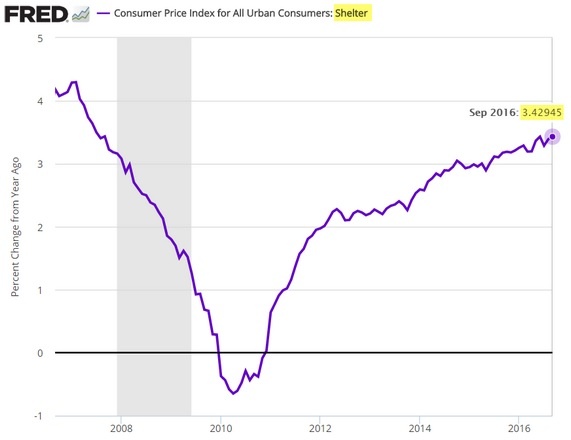
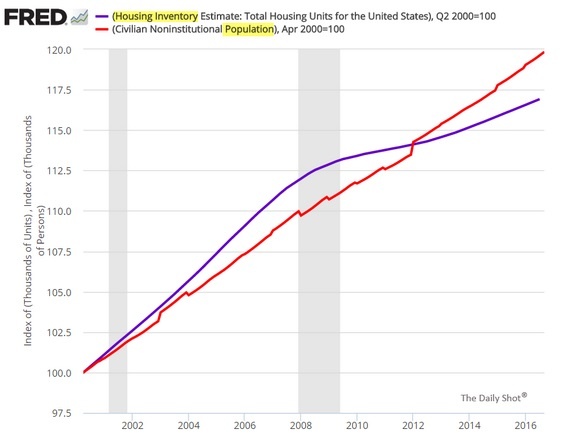
Housing stock is not keeping up with the population growth. it may be one reason the housing prices keep climbing.
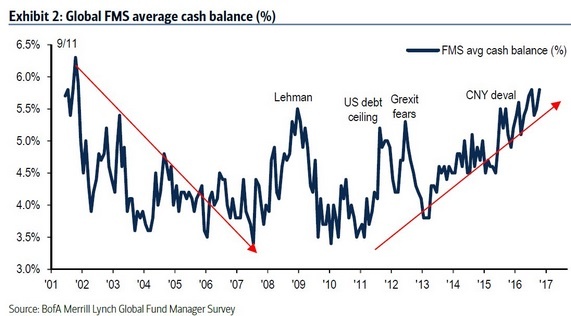
Investors are fearful and raising cash. This could be good or bad.
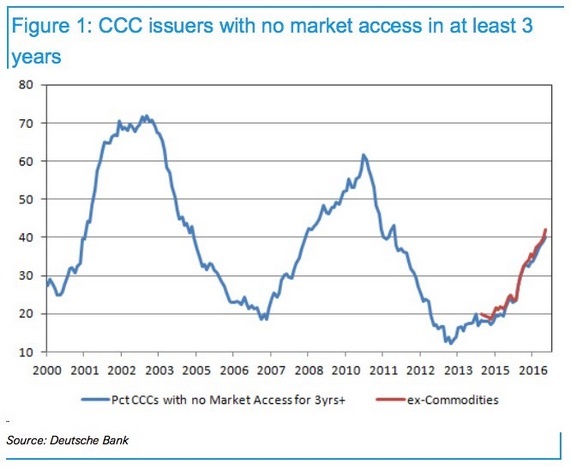
a high yield bond market drying up is not good for refinancing existing debt.
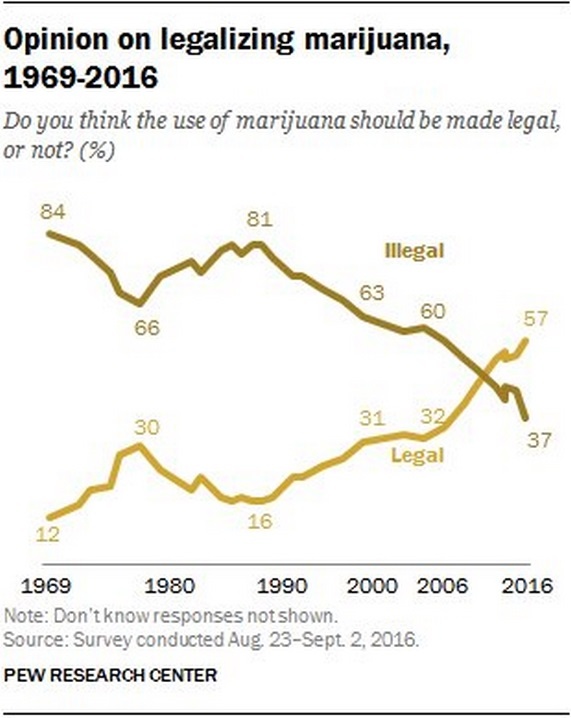
Legalize it?
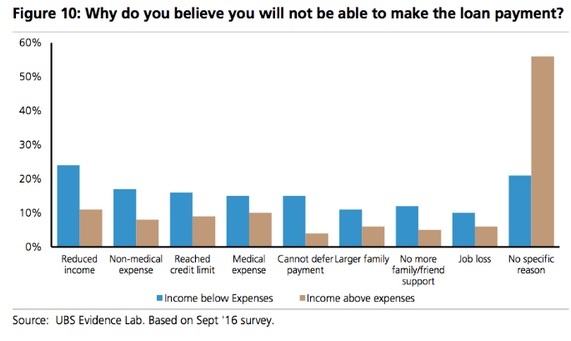
people who will not be able to make a loan payment may already think it is legalized… How can you not know the reasons for defaulting on your loan payment?
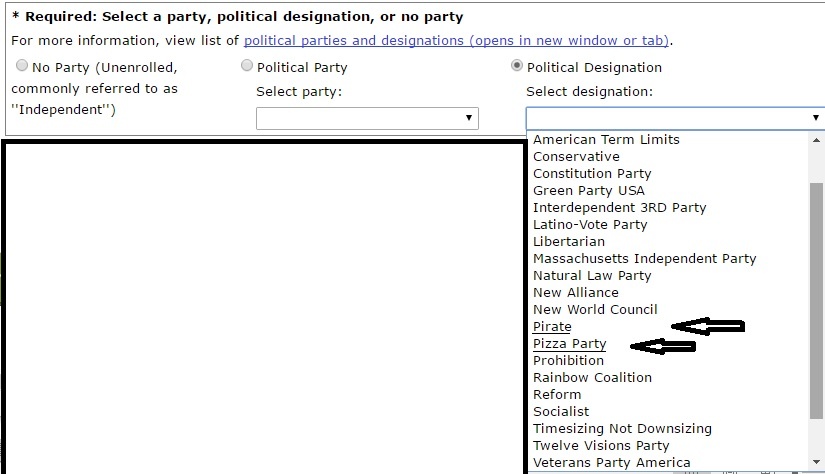
When I went to register online to vote, I noticed this great hidden gem in the state of Massachusetts. I have the choice of having a truly great political designation. I can be a “Pirate” or a part of the “pizza party”. With all the craziness going on you have to take the smiles when you can get them.
Interesting comparison… I guess it depends on what you characterize as middle class.

Interesting…
natural disaster occurrences
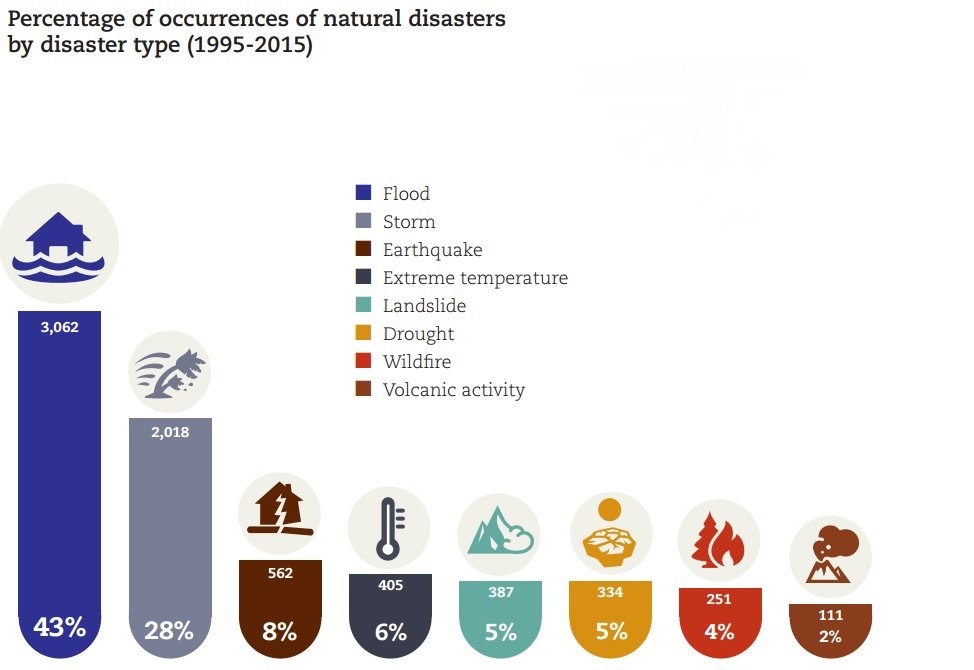
These numbers seem to be off.
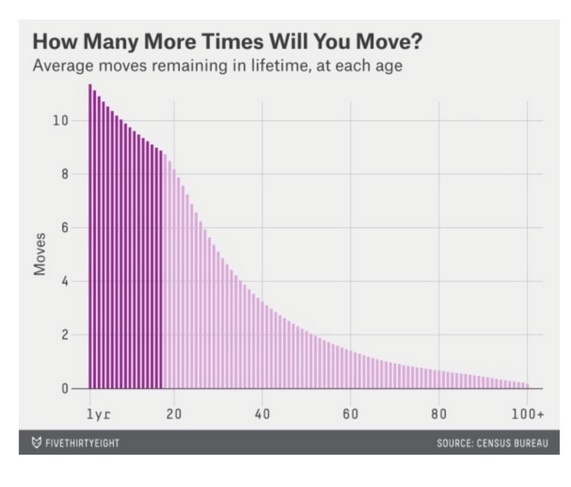
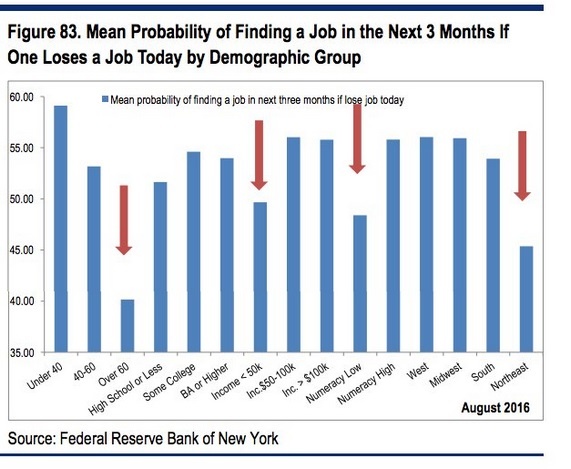
if you are unemployed in the northeast, just move and your chances rise.
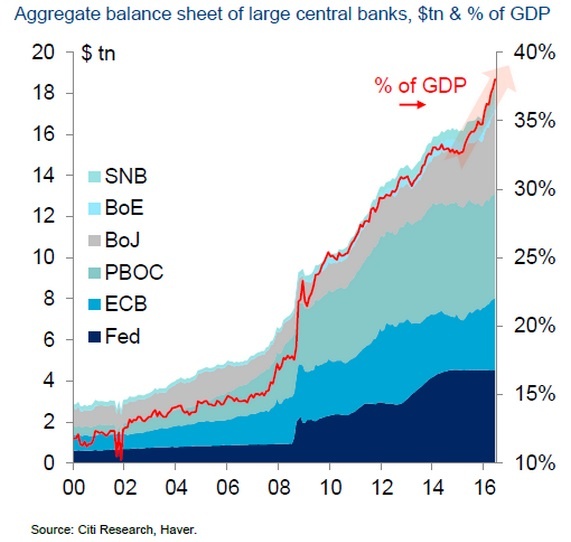
Global QE just keeps climbing. Consider the scale that Central bank balance sheets are growing. It is almost 10x what is was in 2000. WOW
Interesting infographic

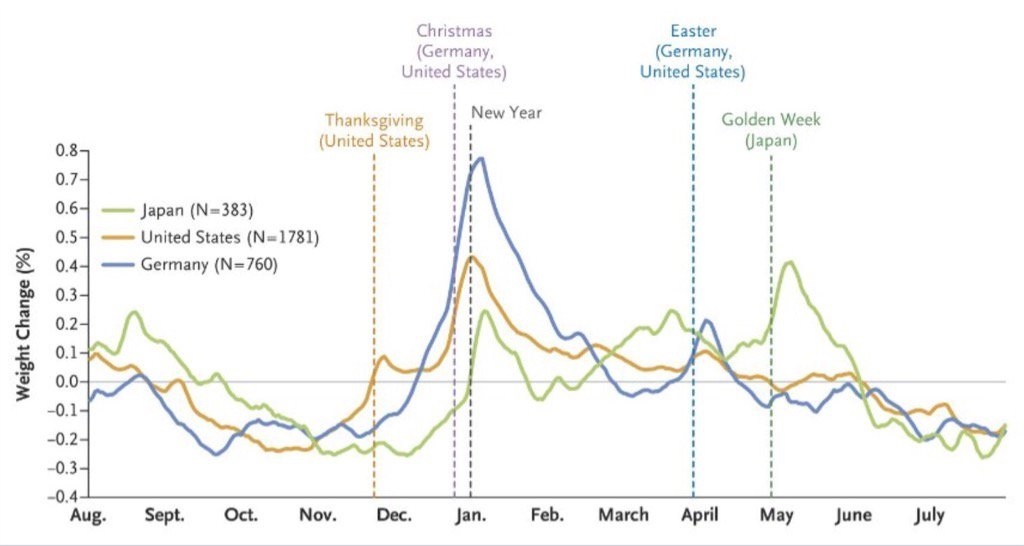
What time of the year should you watch your weight?
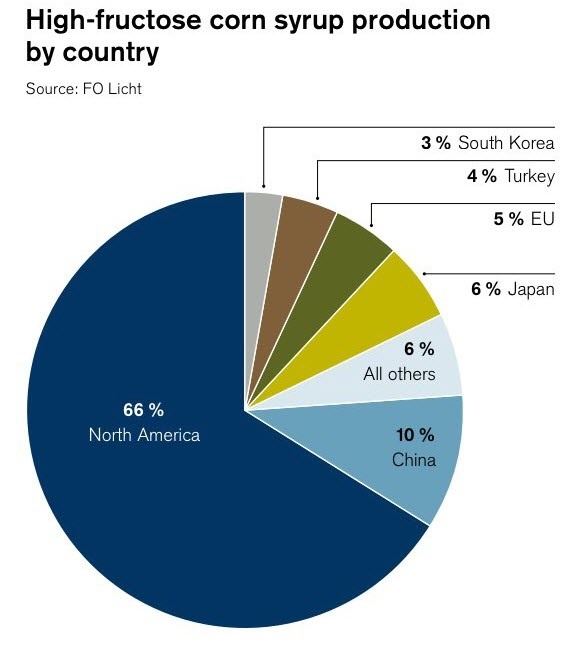
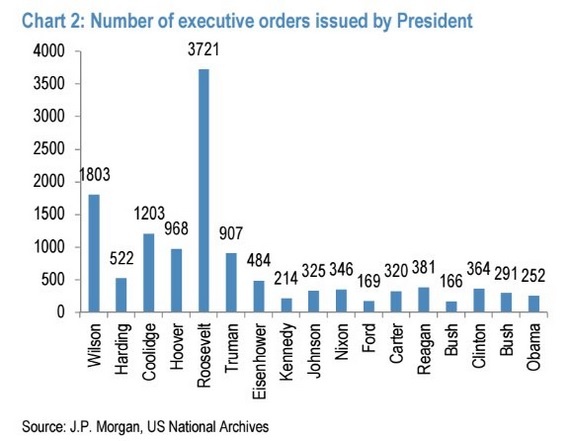
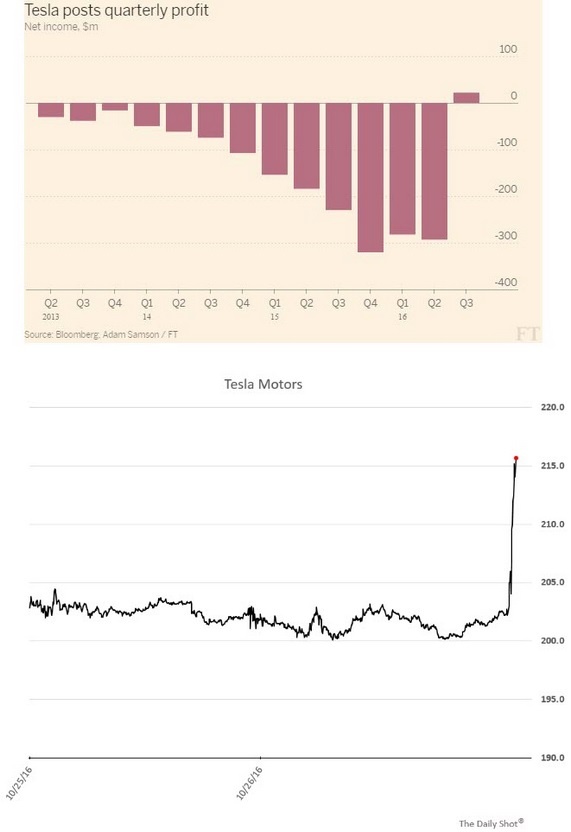
I only put this here because the profit is an interesting aberration.
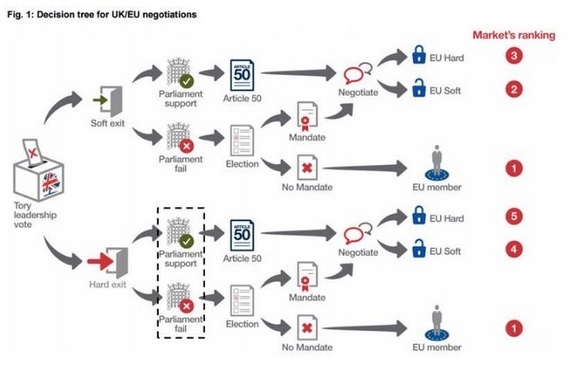
thinking about what the outcome of the Brexit will be? Here is a decision tree.
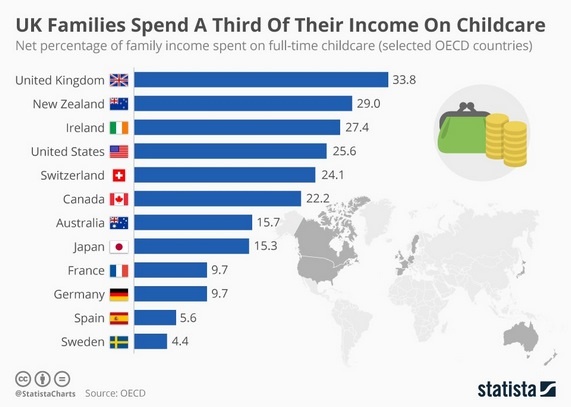
UK citizens love their kids.
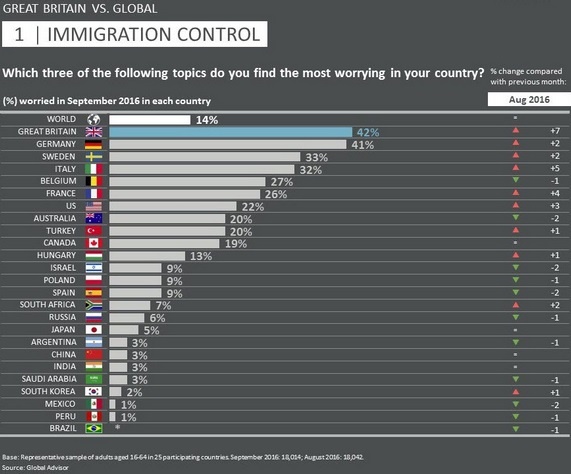
Which countries are the most worried about immigration?
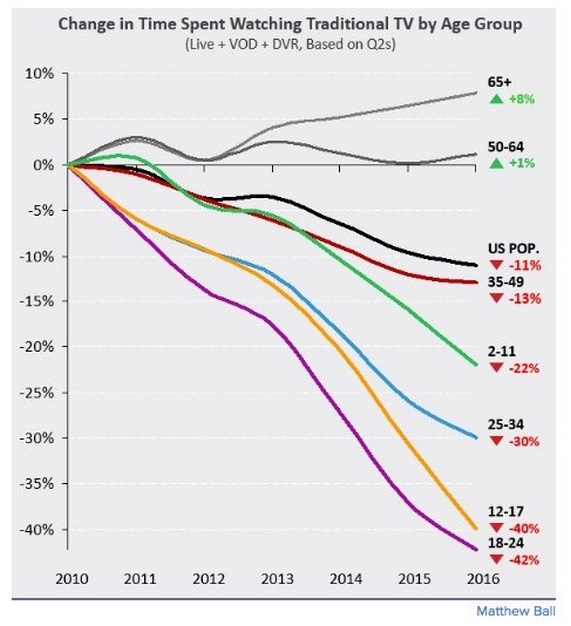
Fewer people are watching TV than in days past. Judging by what is on TV, the trend should be obvious.
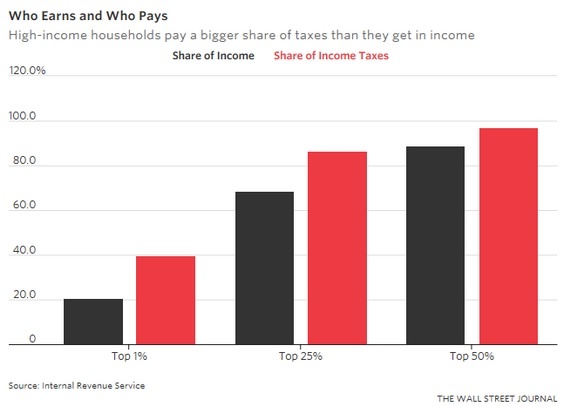
interesting IRS data.
That is enough for now. If you made it through these interesting charts, I have the monthly charts for you to review.
Leading Indicators
Dr. Copper
Dr. Copper is still weak, although there has been a strong bounce in the past few weeks. Copper prices are consolidating at these levels. Watch for a break-up or down from here.

Financials
Fed raised interest rates in December. There hasn’t been one since. There is less than a 50% change they will raise before the year is done, but given the fact that the Fed is more worried about the global economy than the US, I don’t expect to see one at all. The big question is, how is the financial sector going to make money when the spread is shrinking and rates continue to drop and go negative? How will insurance companies and pension funds survive? One more question… What happens when the US has negative interest rates, and that causes people to pull money out of the financial system. If banks create money (and they do via the banking process of lending), this causes inflation. What happens when money is pulled from the system, this could cause a huge amount of deflation to hit most markets. Keep that in the back of your mind if the Fed experiments with negative rates.

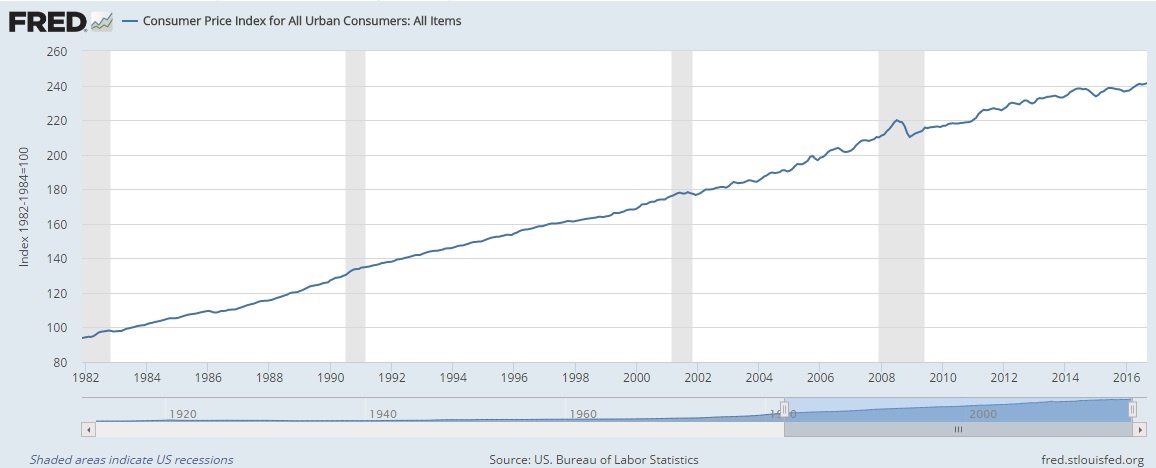
Consumer Price Index (CPI)
Inflation is caused by excess demand. Historically this is caused by a fully-employed economy which also has a huge government spending program in place (which frequently happens in wars).
The CPI is flat for the year. It just started picking up again. If you have read this Inflation Monitor report for the last 12 months you will know that strong deflationary forces are here to stay. The Fed does not want deflation in the US, but can they stop it?
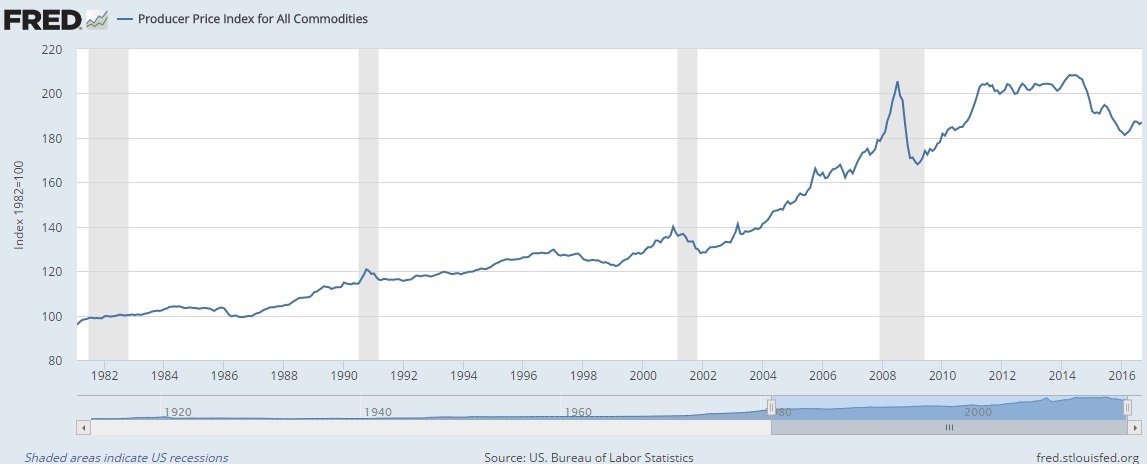
Producer Price Index (PPI)
The Producer Price Index is continuing to have a rough time this year. The declining PPI might be a reflection of the new economic conditions of producers and manufacturing with a high value of the US Dollar. This makes it harder for US companies to export goods since they will be about 20% more expensive from where they were last year.
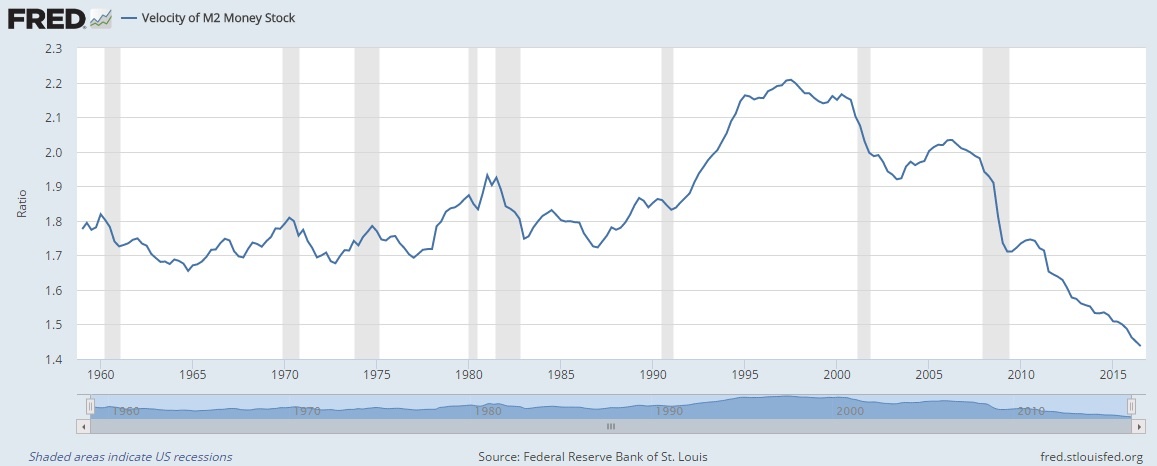
US Velocity of Money M2
There is just no sign of stopping this falling safe. I’ll believe in the hyper-inflation tooth fairy when this starts to turn up in a meaningful way.
Oil Prices
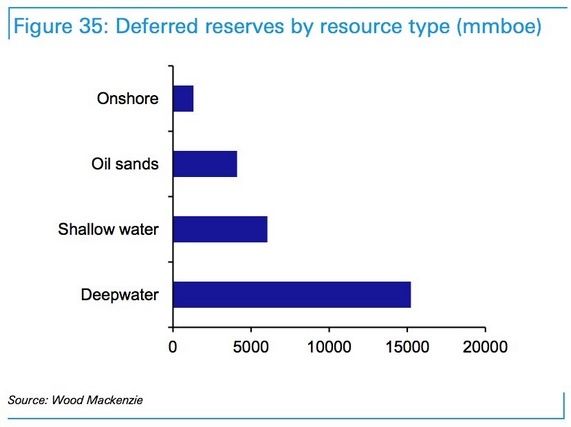
Rystad Energy just released an independent study that shows the US is considered to have more oil reserves than Saudi Arabia or Russia. This is the first time in history where the US has held this title. The study estimates the recoverable oil available in the U.S. at 264 billion barrels. Saudi Arabia has about 212 billion barrels and Russia has about 256 billion barrels.

“We keep thinking that lower energy prices are somehow good for the economy. That can’t be, because energy prices or commodity prices in general don’t drive economic growth. Economic growth drives commodity prices.”
~Stephen Schork
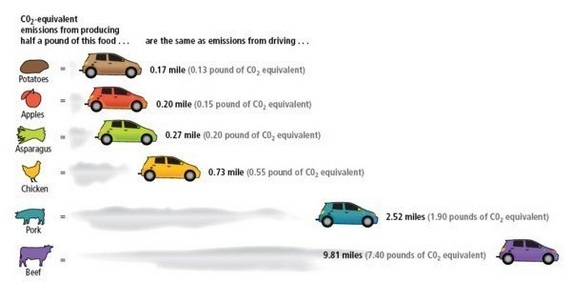
Co2 emissions equivalent from producing a half a pound of food
Oil reserves
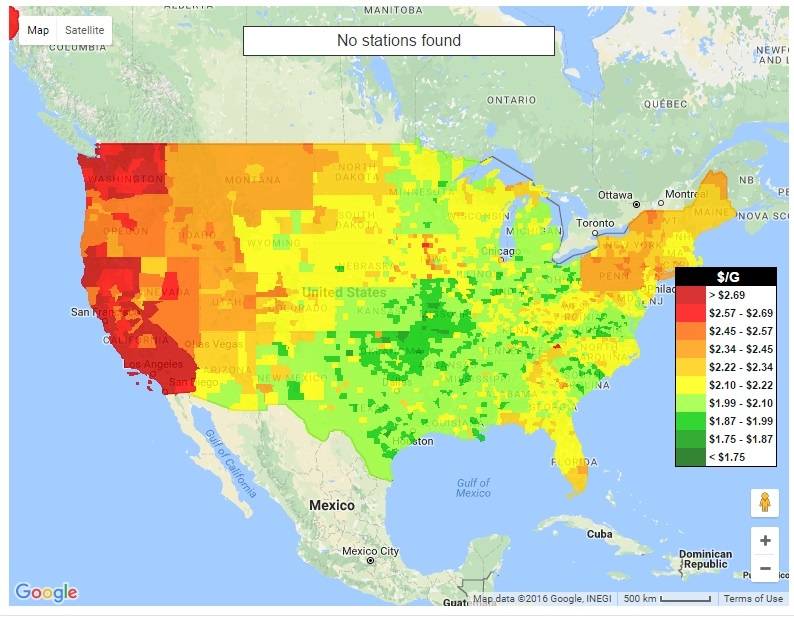
US Gas Prices
Currency Relative Valuations to Gold
Gold is priced in the currency you use every day. If you live in the European Union, you use Euros, if you live in Japan, you use Yen, and if you live in the US you use US dollars. Each of these currencies is used to buy gold in their respective countries, so we look at gold priced in each country to see how people value it in their own currency. This can tell us a lot about the demand for gold inside and outside the US.
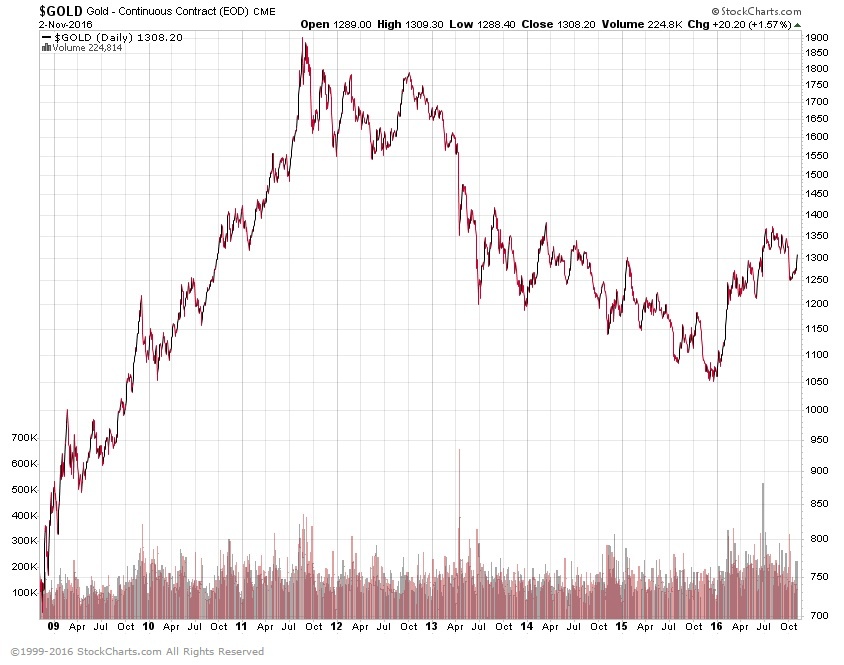
Gold prices are they strong or weak?
The best way to look at any commodity, especially gold, is to compare the commodity to multiple currencies. If gold is rising or falling in US Dollars, that means nothing if the other currencies are not showing the same thing. A true bullish trend in gold is when gold is rising in all (or at least most currencies).
Gold is still in a bull trend.
Gold Priced in Euros

Gold Priced in Yen

Gold Priced in Canadian Dollars

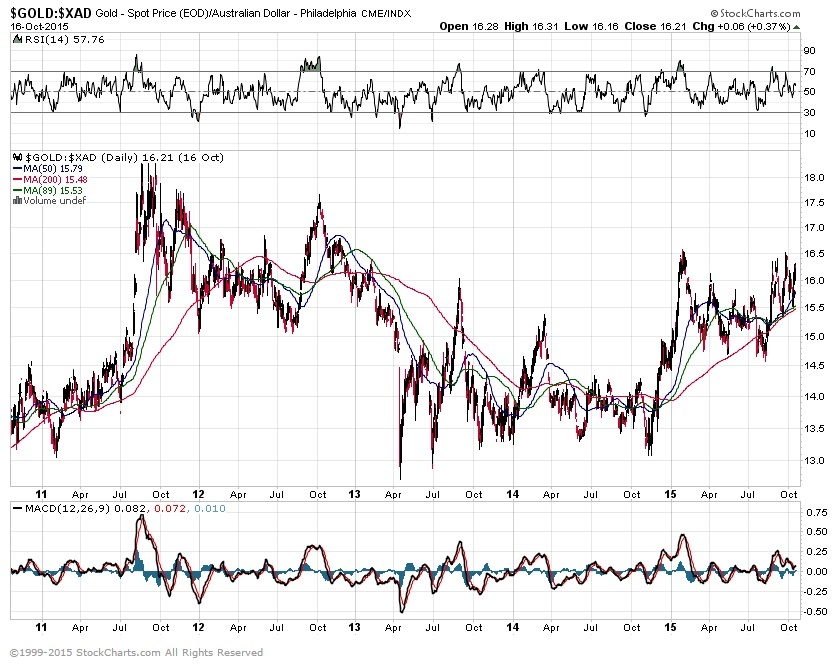
Gold Priced in Australian Dollars

Bonds
TED Spread
A surge in the Ted Spread means a lack of trust in financial institutions. Currently, the Ted Spread is on the high side. It is far from the 2008 highs of 4.6, but the upward trend is not a good sign since it is confirming many other indicators.

10 year vs. 2 year Treasury Spread
The flattening (or inverting) of the yield curve is not good for banks and also typically shows signs on a recession. It is probably one of the best indicators of a recession we have, yet no one knows the status of whether this indicator still works since interest rates are stuck at zero… sorry 0.25% – 0.50%. What happens if the US has negative interest rates? what will the curve look like then?

Treasury vs Corp Bond Spread
The spread between 30-year treasuries and corporate bonds is climbing, as it can be in times of market distress. It will be interesting to see how this plays out as interest rates start to rise… assuming they ever do. Most markets have shown some relief from the risk off pressures earlier this year, but this number is still rising.

High Yield Bonds (Junk Bonds)

Bond Yield Spread
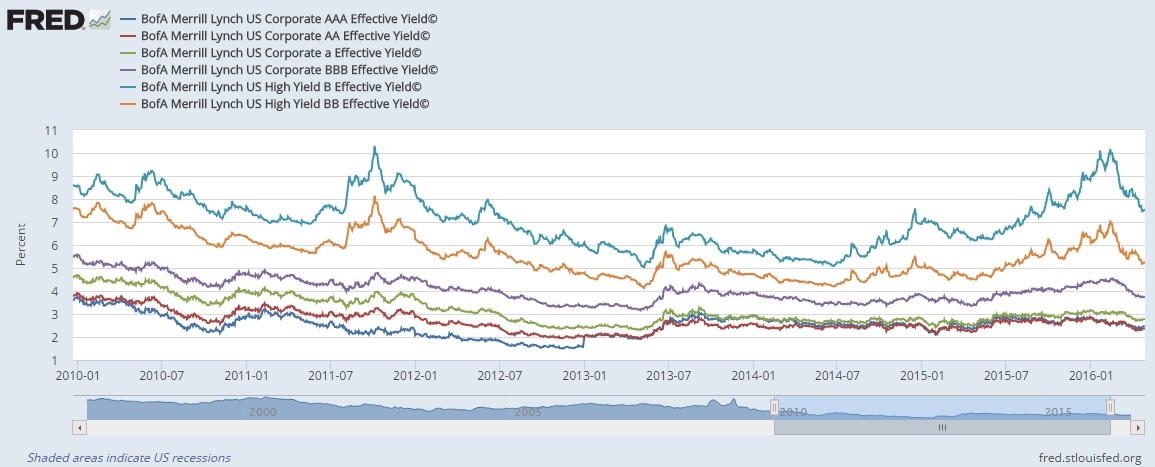
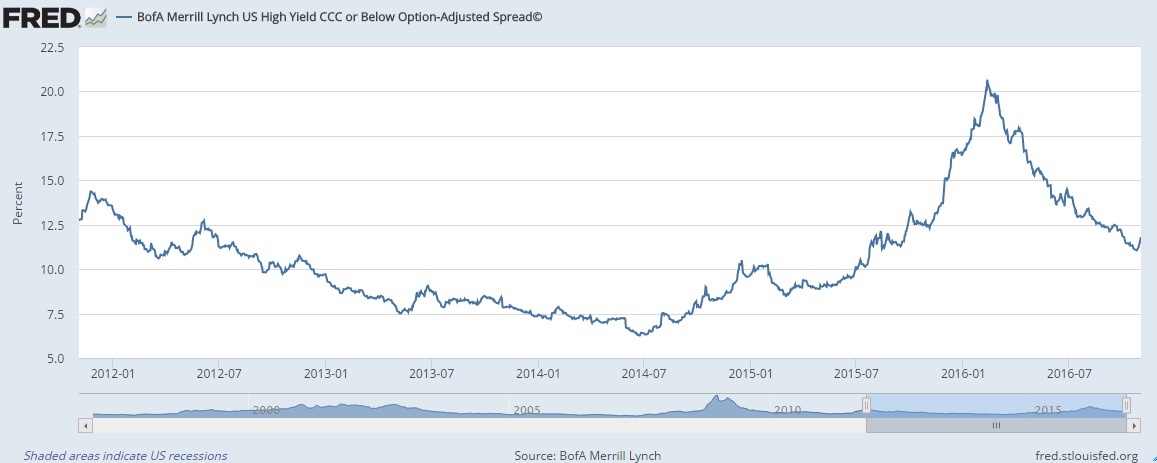
High Yield Bond Spread
The high yield bond market is continuing to cool down. This is a good sign for the overall market.
Asset Class Forecast
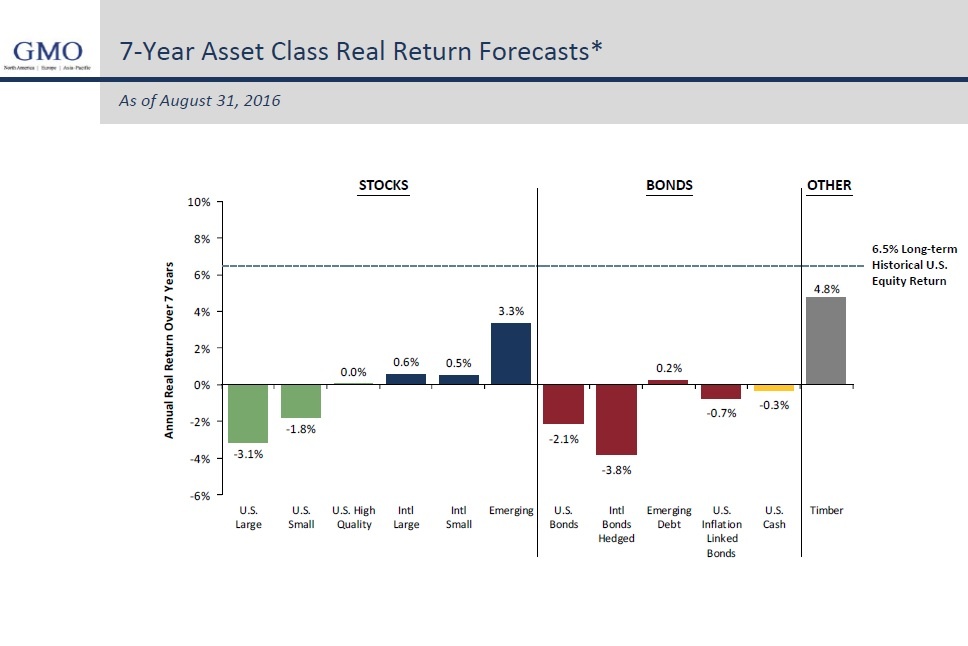
Inflation Dashboard
I like this view from the Federal Reserve because it gives more of a visual perspective of the data presented above.

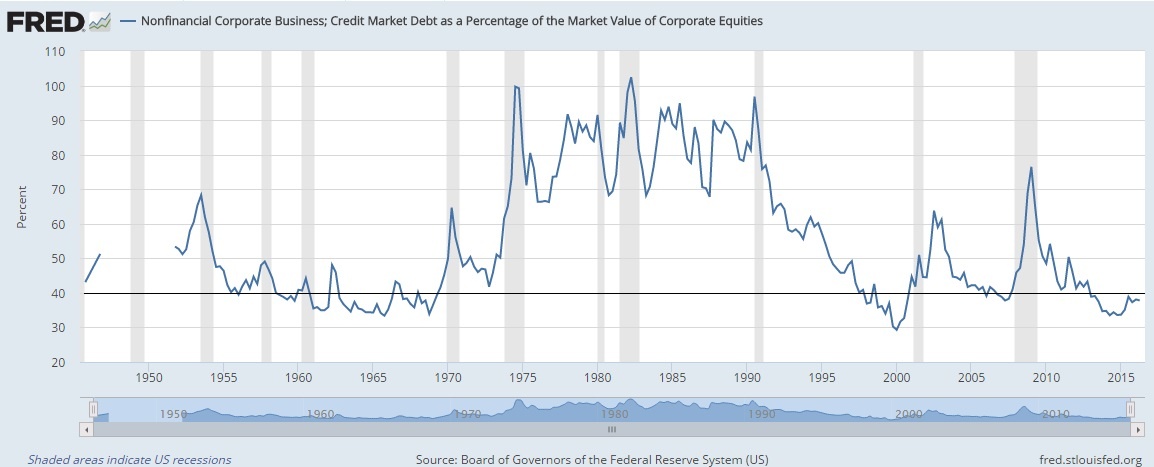
Corporate Debt as a Percentage of Equity
Anything below 40 is when it is dangerous to own stocks.
Baltic Dry Index
After breaking below the index all-time lows late last year, it has rebounded since then. It could be the rise in oil prices, or just that the index can only go so low, where any increase in activity would push it up. While this indicator is not all that important, it is just another piece of information that the global economy is not doing well. Until we see a sustained pickup in dry shipping, the global economy is still not strong.

I hope you enjoyed this month’s Inflation Monitor. See you next month.
Cheers,
![]()
Kirk Chisholm
The IAG Inflation Monitor – Subscription Service
We have been publishing this Inflation Monitor as a free service to anyone who wishes to read it. We do not always expect this to be the case. We expect to charge a small fee for this service starting in 2017. The high amount of interest in this service has put constraints on us to provide more, so this small fee should cover our costs for providing this excellent resource. Our commitment to our wealth management clients is to always provide complimentary access to this research. If you would like to discuss becoming a wealth management client, feel free to contact us.
If you would like to automatically receive the Inflation Monitor in your email inbox each month, click here to join our subscription service.
![]()
Sources:
- Federal Reserve – St. Louis
- U.S. Energy Information Administration
- TD Ameritrade
- National Association of Realtors
- The Economist
- The Commodity Research Bureau
- Gurufocus.com
- Stockcharts.com
- GasBuddy
* IAG index calculations are based on publicly available information.
** IAG Price Composite indexes are based on publicly available information.
About Innovative Advisory Group: Innovative Advisory Group, LLC (IAG), an independent Registered Investment Advisory Firm, is bringing innovation to the wealth management industry by combining both traditional and alternative investments. IAG is unique in that we have an extensive understanding of the regulatory and financial considerations involved with self-directed IRAs and other retirement accounts. Innovative Advisory Group advises clients on traditional investments, such as stocks, bonds, and mutual funds, as well as advising clients on alternative investments. IAG has a value-oriented approach to investing, which integrates specialized investment experience with extensive resources.
For more information, you can visit: innovativewealth.com
About the author: Kirk Chisholm is a Wealth Manager and Principal at Innovative Advisory Group. His roles at IAG are co-chair of the Investment Committee and Head of the Traditional Investment Risk Management Group. His background and areas of focus are portfolio management and investment analysis in both the traditional and non-traditional investment markets. He received a BA degree in Economics from Trinity College in Hartford, CT.
Disclaimer: This article is intended solely for informational purposes only, and in no manner intended to solicit any product or service. The opinions in this article are exclusively of the author(s) and may or may not reflect all those who are employed, either directly or indirectly or affiliated with Innovative Advisory Group, LLC.