
| Index | Value | 1mo change | 1yr change | 5yr change | Inflation Score |
|---|---|---|---|---|---|
| Economic Inflation | |||||
| Consumer Price Index (CPI) | 237.95 | -0.16% | -0.04% | 8.93% | 2 |
| Producer Price Index (PPI) | 189.10 | -1.61% | -8.38% | 2.27% | 1 |
| 1 Yr Treasury Bill Yield | 0.37% | -0.01 | 0.26 | 0.11 | 2 |
| 10 Yr Treasury Note Yield | 2.05% | -0.06 | -0.25 | 0.49 | 2 |
| Real Interest Rate | 0.41% | 0.22 | 1.95 | 1.29 | 3 |
| US 10 yr TIPS | 0.59% | -0.01 | 0.21 | 0.06 | 2 |
| Capacity utilization | 77.50 | -0.39% | -1.27% | 3.20% | 3 |
| Industrial Production Index | 107.09 | -0.19% | 0.39% | 11.89% | 3 |
| Personal Consumption Expenditure Index | 12,388.8 | 0.45% | 3.53% | 20.90% | 4 |
| Rogers International Commodity Index | 2287.64 | -4.51% | -16.78% | -26.10% | 1 |
| SSA COLA | 0.00% | 1.70% | 3 | ||
| Median Income | $51,939.00 | 1.81% | 3.25% | 3 | |
| Real Median Income | $51,939.00 | 0.35% | -4.56% | 3 | |
| Consumer Interest in Inflation | Stable | 3 | |||
| IAG Inflation Composite | Slight Deflation | 2 | |||
| IAG Online Price Index | Slight Deflation | 2 | |||
| US GDP | 17913.70 | 1.50% | 3.73% | 20.32% | 3 |
| S&P 500 | 1923.82 | 0.52% | -0.69% | 64.21% | 3 |
| Market Cap to GDP | 112.30% | 120.10% | 81.80% | 5 | |
| US Population | 321,467 | 0.06% | 0.73% | 4.03% | 2 |
| IAG Economic Inflation Index* | Slight Deflation | 2 | |||
| Housing Inflation | |||||
| Median Home price | 228,700.00 | -2.26% | 4.72% | 28.99% | 4 |
| 30Yr Mortgage Rate | 3.89% | -0.02 | -0.27 | -0.46 | 4 |
| Housing affordability | 157.70 | 2.07% | -1.56% | 2 | |
| US Median Rent | 803.00 | 6.22% | 15.71% | 4 | |
| IAG Housing Inflation Index* | Mild Inflation | 4 | |||
| Monetary Inflation | |||||
| US Govt debt held by Fed (B) | 2,797.50 | 0.15% | 7.00% | 260.18% | 1 |
| US Debt as a % of GDP (B) | 101.33% | -1.52% | -0.77% | 12.66% | 2 |
| M2 Money Stock (B) | 12,145.00 | 0.72% | 6.20% | 40.86% | 4 |
| Monetary Base (B) | 4,049.24 | 1.19% | -0.56% | 104.39% | 2 |
| Outstanding US Gov’t Debt (B) | 18,151.998 | 0.00% | 2.95% | 37.50% | 4 |
| Velocity of Money [M2] | 1.50 | 0.27% | -2.02% | -13.69% | 2 |
| US Trade Balance | -48,330.00 | -15.60% | -17.09% | -7.59% | 1 |
| Big Mac Index | Expensive | 1 | |||
| US Dollar | 96.40 | 0.53% | 11.45% | 22.04% | 1 |
| IAG Monetary Inflation Index* | Mild Deflation | 2 | |||
| Energy | |||||
| Electricity (cents / KW hour) | 12.98 | 0.39% | -0.54% | 3 | |
| Coal (CAPP) | 48.65 | 0.10% | -13.59% | -32.80% | 1 |
| Oil | 45.38 | -5.65% | -50.33% | -43.16% | 1 |
| Natural Gas | 2.52 | -6.25% | -38.93% | -34.68% | 1 |
| Gasoline | 1.37 | -6.10% | -44.02% | -32.53% | 1 |
| IAG Energy Inflation Index* | Strong Deflation | 1 | |||
| Food and Essentials | |||||
| Wheat | 512.00 | 5.68% | 7.39% | -24.04% | 4 |
| Corn | 387.75 | 3.54% | 21.08% | -21.63% | 5 |
| Soybeans | 891.50 | 0.73% | -2.14% | -19.36% | 3 |
| Orange Juice | 108.30 | -16.11% | -25.23% | -30.91% | 1 |
| Sugar | 12.87 | 20.28% | -21.43% | -45.76% | 1 |
| Live Cattle | 131.00 | -8.28% | -19.80% | 31.66% | 1 |
| Cocoa | 3120 | 0.32% | -4.70% | 10.21% | 2 |
| Coffee | 121.30 | -2.37% | -37.47% | -33.95% | 1 |
| Cotton | 60.30 | -4.22% | -1.74% | -40.82% | 3 |
| Stamps | $0.49 | 0.00% | 6.52% | 11.36% | 4 |
| CRB Foodstuffs Index | 359.79 | 0.41% | -14.37% | -15.32% | 1 |
| IAG Food and Essentials Inflation Index* | Strong Deflation | 1 | |||
| Construction and Manufacturing | |||||
| Copper | 2.26 | -3.55% | -24.94% | -38.25% | 1 |
| Lumber | 226.30 | -2.88% | -32.25% | -1.18% | 1 |
| Aluminum | 0.70 | -3.64% | -19.15% | -31.71% | 1 |
| CRB Raw Industrials | 434.49 | -1.57% | -14.60% | -17.91% | 1 |
| Total Construction Spending (M) | 1,086,224.00 | 0.66% | 13.74% | 31.56% | 5 |
| ISM Manufacturing Index | 50.20 | -1.76% | -10.52% | -10.83% | 1 |
| IAG Construction & Manufacturing Index* | Strong Deflation | 1 | |||
| Precious Metals | |||||
| Gold | 1,114.50 | -1.70% | -8.15% | -14.90% | 1 |
| Silver | 14.50 | -0.68% | -14.58% | -34.46% | 1 |
| IAG Precious Metals Inflation Index* | Strong Deflation | 1 | |||
| Innovative Advisory Group Index | |||||
| IAG Inflation Index Composite* | Mild/Strong Deflation | 1 / 2 | |||
* If you would like a description of terms, calculations, or concepts, please visit our Inflation monitor page to get additional supporting information. We will continually add to this page to provide supporting information.
* Our Inflation Score is based on a proprietary algorithm, which is meant to describe the respective category by a simple number. The scores range from 1-5. One (1) being the most deflationary. Five (5) being the most inflationary. These scores are meant to simplify each item and allow someone to quickly scan each item or section to see the degree of which inflation or deflation is present.
* We have also added our own indexes to each category to make it even easier for readers to receive a summary of information.
Inflation Monitor Summary – Composite Ranking

* The Inflation Equilibrium is a quick summary for the whole data series of the inflation monitor. If you don’t like statistics, this is the chart for you.
Inflation Monitor – October 2015 – Introduction
The last month has been really interesting. My prediction seems to be coming true. I have stated for most of this year that the second half (3rd or 4th quarter) of this year would show the US entering into a recession. While I still believe that the US has a strong economy relative to the rest of the world. There are just too many factors bringing it down.
Many of the powerful business interests and academic economists in the US have been pushing for a more global economy in the past few decades. Now that we have a more global economy, it is more interconnected than ever. With the benefits of this type of system, come drawbacks. Having global booms and busts is one of those symptoms.
Despite what the media personalities say on TV, the US is not an island. The US cannot decouple their economy from the rest of the world. I am not aware of this happening in any meaningful way for the past few decades. Prior to that, the global economy was not as interconnected, so any data would be less relevant in answering that question. I have not analyzed the prior data, but I assume it has a similar theme to what we have now.
What is important to remember is that the global economy is interconnected by money flows, relative currency valuations, asset valuations, inflation, jobs and many other factors. Most countries are dependent on one or more other countries for their economic prosperity. Unless the world’s nations decide to get into a economic battle as they did going into the great depression, this dependency will not change.
While this service is called the inflation monitor, it is important to discuss the economy as well since it has such an important bearing on inflation and deflation. But as you know if you have been reading this for any amount of time, most of what is driving inflation or deflation at the moment is debt.
I do not want to be hyperbolic, but the debt bubble that exists today is extremely dangerous. When it pops, a huge amount of wealth will be destroyed. While this bubble can be managed, as it has been up to this point, the Fed is not strong enough to control the global economy’s debt.
There is one point I want to leave you with. Bear markets are dangerous, they are not a time to “make money”. The most important thing you can do in a bear market is to “not lose money”. Depending on the nature of it, this might be harder than you imagine. Logic does not always prevail in a bear market. 2008-2009 should have taught you that lesson, please go back and refresh your memory before the market does it for you.
I hope you enjoy this month’s Inflation Monitor – October 2015.
Kirk Chisholm
As always, please contact me with any questions or to send your feedback. Thank you for reading.
Join our email list to receive the Inflation Monitor sent directly to your inbox.
![]()
Charts of the Month
Leading Indicators
Dr. Copper
Dr. Copper is still weak, but we could see a start to it turning around. It looks as if it has found support at around $2.20.

Financials
Financial have hit a rough patch. Things are changing in the financial sector. While most financial companies are more solid than they were 5-7 years ago, some problems are still affecting the sector. Things like fines and penalties, yield spreads, lending rates, lack of trading desk revenue,

Consumer Price Ratio (CPI)
The CPI is flat and slightly negative. If you have read this Inflation Monitor report for the last 12 months you will know that strong deflationary forces are here to stay. The Fed does not want deflation in the US, but can they stop it? We will find out soon enough what tricks they have up their sleeve.

Producer Price Index (PPI)
The Producer Price Index is having a rough time this year. This data suggests that there is a recession nearby, but it is not definitive proof. This data seems to match up to other data we review suggesting a recession is close. Unless the US Dollar drops down to its previous lows or there is another round of QE, there will be a recession soon, if we are not already currently in it. Only time will tell.
Recessions are only seen in hindsight. Between now and 6 months from now, it should be obvious to everyone. While there are things the Fed could do to stop it, they shouldn’t. The US needs a recession to let some of the excessive debt work itself out of the system to make our economy stronger. Will this happen? It is hard to say, but the Fed seems deathly afraid of recessions and deflation, so anything could happen. Now is a time to be cautious, not greedy.

US Velocity of Money M2
This is a clear sign that inflation is not around the corner. Don’t bother even looking for it. Once again deflation is the active trend.

ISM Manufacturing
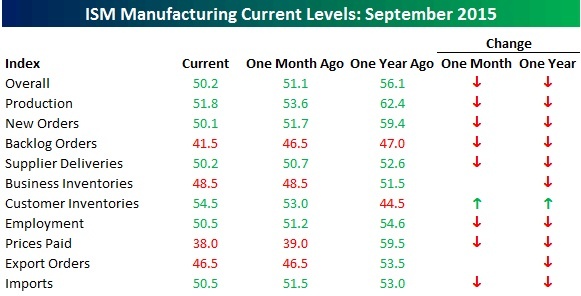
This doesn’t look good for manufacturing.
Total debt as a % of GDP in developed countries
The US is certainly not in good shape with the amount of debt they have outstanding, but this chart puts things into perspective when you compare the US to other developed countries. Japan is in a league all its own. People have been saying Japan is going to implode for decades, yet they continue to plug along at almost double the debt to GDP of the US. I guess the US is not always #1… thankfully.

China
China is an enormous economy. If you look at the picture below you will see exactly how large of an influence it actually is on the world’s demand of commodities.If you want to know why commodity prices have been dropping in the past few years, this may hold a clue. You should note that despite China’s claims of still growing around 7%, reality does not reflect this number. A lot of people dispute China’s numbers are being manipulated. It would make sense that their economy is slowing and commodity demand also happens to be dropping. How long will this trend of low commodity prices continue?

Gas Prices in Massachusetts
You should note that the spread in difference between the high and low part of the color chart is $0.13. This is a much different picture than a year ago when the spread was much higher.

Gas Prices in the US
This is a map of US gas prices. As you can see, this month is not much different from last month’s chart. California is still keeping prices high for their residents.

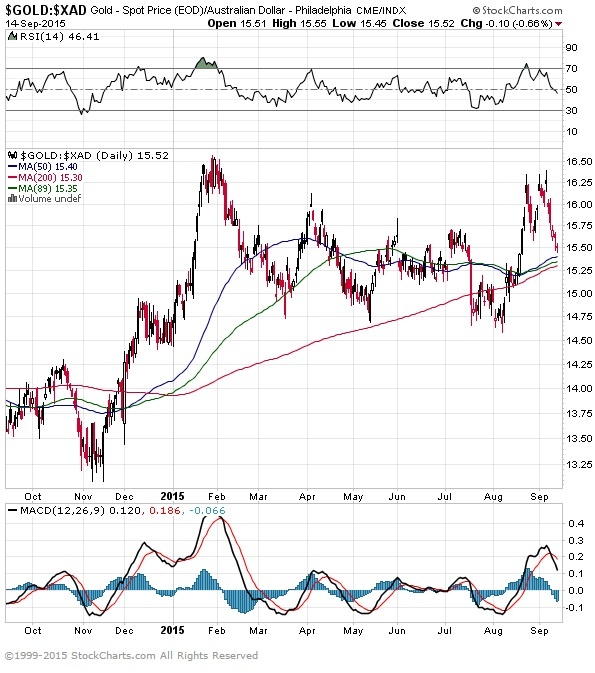
Currency Relative Valuations to Gold
Gold is priced in the currency you use every day. If you live in the European Union, you use Euros, if you live in Japan, you use Yen, and if you live in the US you use US dollars. Each of these currencies are used to buy gold in their respective countries, so we look at gold priced in each country to see how people value it in their own currency. This can tell us a lot about the demand for gold inside and outside the US.
Gold prices are they strong or weak?
The US seems to be the only country where gold is not rebounding off the bottom. Maybe a good recession will put some fire under the price.

Gold Priced in Euros

Gold Priced in Yen

Gold Priced in Canadian Dollars

Gold Priced in Australian Dollars

Bonds
TED Spread
A surge in the Ted Spread means a lack of trust in financial institutions. This is not a good trend, although it is off low. It is far off the 2008 highs of 4.6, but the upward trend is not a good sign, since it is confirming many other indicators.

10 year vs. 2 year Treasury spread

Treasury vs corp bond spread

High Yield Bonds (Junk Bonds)
High yield bonds are in a serious correction at the moment. I suppose when high yield bonds reach the all-time low yield of 5%, it is only a matter of time before the bubble pops and defaults start to skyrocket.
Edward Altman, who is a professor at New York University, developed the Z-Score method for predicting bankruptcies. Recently he said this about high yield bonds,
“Defaults will breach the historical high next year and the Fed is the “wild card” that has the power to determine how quickly the current credit cycle ends.” – Edward Altman

At the peak of 2008-2009, the spreads were 3x of where they are now at over 20%

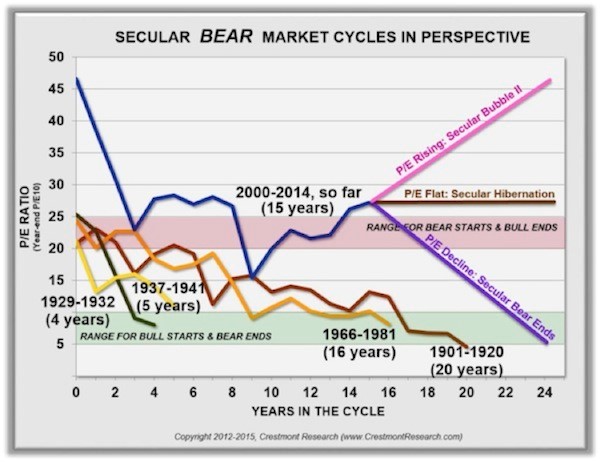
Bear Market Cycles
Most market cycles have a number of similarities. The similarities are such that investors look for patterns to emerge so that they might predict future movements of equity markets. Below is an example of this type of chart. While it is not certain that a recession has begun, it would appear that one is close, so that this chart might give some insight into what might happen in future years.
US Taxes
These charts show the history of US tax receipts collected. It would appear as if the US government has never collected more than 20% of the GDP in tax receipts in the past 100 years. Next time you hear your favorite politician talk about raising taxes, you should know that it is highly unlikely that the proposed benefits will actually end up in the government coffers. Even during the period of time when the marginal tax rates were as high as 90%+ (from 1943-1963), the US marginal tax rates never exceeded 20% of tax receipts of GDP. Amazing statistics. Maybe taxing the rich won’t work after all. Don’t assume your local politician got this message.


Where do your tax dollars go?
Have you ever wondered where your tax dollars go? In 2013 this is where they went. 69% going to some form of social welfare, 18% going to national defense, and only 1% going to K-12 education. I won’t get on my soapbox here, but I think the numbers speak for themselves.

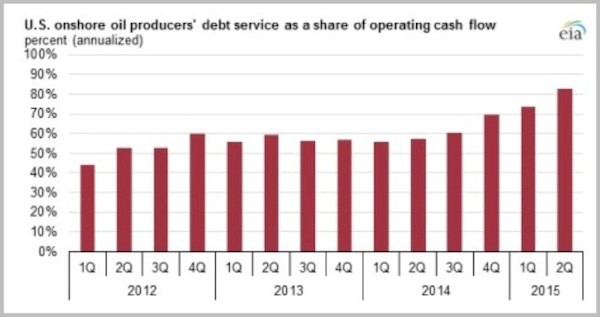
Oil Producers
Many people are salivating at the thought of buying oil producers with their over-sized dividends. While this is appealing, this chart shows you that the dividends may not be as safe as you might think. If 82% of the oil producers’ cash flow is going to service their debt, how much can go to capital expenditures, dividends, or share repurchases? Apparently 18% and falling. Many of these companies have been cutting their capital expenditures. Cutting share repurchases are next, then dividends are last. A company that cuts its dividends shows that it is in trouble. Especially when it has paid and increased dividends for over 20 years. While this is a great time to look for bargains, don’t count on all oil companies to continue to pay their thick dividend yields. If you want more insight into my thoughts of investing in oil companies, you can read my prior post, Is it time to buy oil stocks?
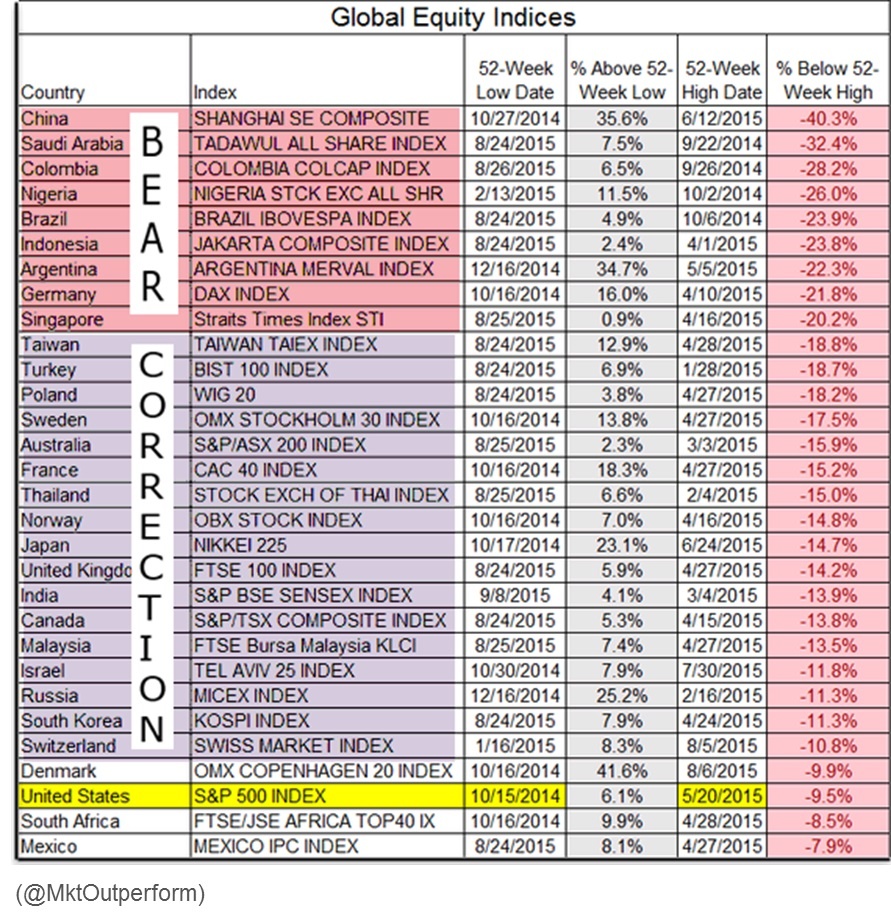
Global Equities
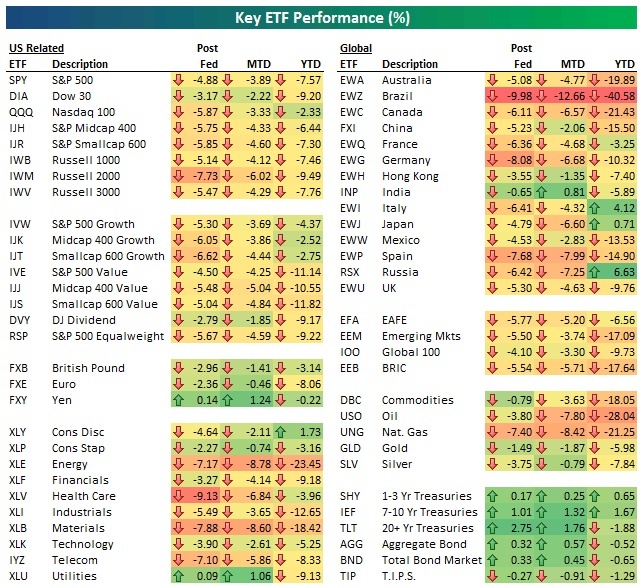
Source: Bespoke https://www.bespokepremium.com/think-big/
Alternative Investments
Yale University Endowment
Recently Yale came out with their endowment asset allocation targets.
- Absolute return: 21.5%
- Leveraged buyouts: 16%
- Foreign Equity: 14.5%
- Venture Capital: 14%
- Real estate: 13%
- Natural resources: 8.5%
- Bonds and cash: 8.5%
- Domestic equity: 4%
Apparently, David Swensen, Yale’s Chief Investment Officer, does not have a lot of faith in the US equity markets.
Harvard University Endowment
Here is Harvard University endowment’s asset allocation numbers.

I hope you enjoyed this month’s Inflation Monitor. See you next month.
Cheers,
![]()
Kirk Chisholm
The IAG Inflation Monitor – Subscription Service
We are initially publishing this Inflation Monitor as a free service to anyone who wishes to read it. We do not always expect this to be the case. Due to the high demand for us to publish this service from a wide variety of people who subscribe, we do at some point in the next 12 months expect to charge for this service. Our commitment to our wealth management clients is to always provide complimentary access to our research. If you would like to discuss becoming a wealth management client, feel free to contact us.
If you would like to automatically receive the Inflation Monitor in your email inbox each month, click here to join our free subscription service.
![]()
Sources:
- Federal Reserve – St. Louis
- U.S. Energy Information Administration
- U.S. Post Office
- National Association of Realtors
- The Economist
- The Commodity Research Bureau
- Gurufocus.com
- Stockcharts.com
- GasBuddy
* IAG index calculations are based on publicly available information.
** IAG Price Composite indexes are based on publicly available information.
About Innovative Advisory Group: Innovative Advisory Group, LLC (IAG), an independent Registered Investment Advisory Firm, is bringing innovation to the wealth management industry by combining both traditional and alternative investments. IAG is unique in that we have an extensive understanding of the regulatory and financial considerations involved with self-directed IRAs and other retirement accounts. IAG advises clients on traditional investments, such as stocks, bonds, and mutual funds, as well as advising clients on alternative investments. IAG has a value-oriented approach to investing, which integrates specialized investment experience with extensive resources.
For more information, you can visit: innovativewealth.com
About the author: Kirk Chisholm is a Wealth Manager and Principal at Innovative Advisory Group. His roles at IAG are co-chair of the Investment Committee and Head of the Traditional Investment Risk Management Group. His background and areas of focus are portfolio management and investment analysis in both the traditional and non-traditional investment markets. He received a BA degree in Economics from Trinity College in Hartford, CT.
Disclaimer: This article is intended solely for informational purposes only, and in no manner intended to solicit any product or service. The opinions in this article are exclusively of the author(s) and may or may not reflect all those who are employed, either directly or indirectly or affiliated with Innovative Advisory Group, LLC.