| Index | Value | 1mo change | 1yr change | 5yr change | Inflation Score |
|---|---|---|---|---|---|
| Economic Inflation | |||||
| Consumer Price Index (CPI) | 237.84 | -0.04% | 0.07% | 8.75% | 2 |
| Producer Price Index (PPI) | 187.7 | -0.74% | -7.72% | 0.59% | 1 |
| 1 Yr Treasury Bill Yield | 0.26% | -0.11 | 0.16 | 0.03 | 2 |
| 10 Yr Treasury Note Yield | 2.20% | 0.07 | -0.15 | 0.56 | 2 |
| Real Interest Rate | 0.09% | -0.32 | 1.65 | 1.03 | 3 |
| US 10 yr TIPS | 0.65% | 0.06 | 0.22 | -0.02 | 2 |
| Capacity utilization | 77.50 | -0.26% | -1.27% | 3.33% | 3 |
| Industrial Production Index | 107.21 | -0.15% | 0.34% | 12.29% | 3 |
| Personal Consumption Expenditure Index | 12,389.2 | 0.13% | 3.35% | 20.65% | 4 |
| Rogers International Commodity Index | 2305.84 | 0.80% | -16.12% | -34.50% | 1 |
| SSA COLA | 0.00% | 0.00% | 3 | ||
| Median Income | $53.657.00 | 0.13% | 7.79% | 3 | |
| Real Median Income | $53,657.00 | -1.48% | -2.31% | 3 | |
| Consumer Interest in Inflation | Stable | 3 | |||
| IAG Inflation Composite | Strong Deflation | 1 | |||
| IAG Online Price Index | Slight Deflation | 2 | |||
| US GDP | 18034.80 | 0.68% | 2.93% | 19.77% | 4 |
| S&P 500 | 2104.5 | 9.37% | 2.91% | 75.50% | 4 |
| Market Cap to GDP | 120.80% | 120.10% | 81.80% | 5 | |
| US Population | 322,536 | 0.06% | 0.73% | 4.12% | 2 |
| IAG Economic Inflation Index* | Slight Deflation | 2 | |||
| Housing Inflation | |||||
| Median Home price | 221,900.00 | -2.89% | 6.12% | 29.46% | 4 |
| 30Yr Mortgage Rate | 3.8% | -0.09 | -0.24 | -0.43 | 4 |
| Housing affordability | 163.50 | 3.55% | -2.85% | 2 | |
| US Median Rent | 803.00 | 6.22% | 15.71% | 4 | |
| IAG Housing Inflation Index* | Mild Inflation | 4 | |||
| Monetary Inflation | |||||
| US Govt debt held by Fed (B) | 2,797.50 | 0.15% | 7.00% | 260.18% | 1 |
| US Debt as a % of GDP (B) | 101.33% | -1.52% | -0.77% | 12.66% | 2 |
| M2 Money Stock (B) | 12,176.10 | 0.33% | 5.86% | 40.23% | 4 |
| Monetary Base (B) | 4,075.94 | 0.66% | 1.42% | 105.09% | 3 |
| Outstanding US Gov’t Debt (B) | 18,151.998 | 0.00% | 2.95% | 37.50% | 4 |
| Velocity of Money [M2] | 1.49 | -0.87% | -2.81% | -14.68% | 2 |
| US Trade Balance | -40,812.00 | -15.01% | 5.50% | 7.33% | 1 |
| Big Mac Index | Expensive | 1 | |||
| US Dollar | 96.82 | 0.43% | 11.12% | 25.56% | 1 |
| IAG Monetary Inflation Index* | Mild Deflation | 2 | |||
| Energy | |||||
| Electricity (cents / KW hour) | 12.93 | -0.39% | -0.69% | 3 | |
| Coal (CAPP) | 49.00 | 0.72% | -12.97% | -32.32% | 1 |
| Oil | 46.43 | 2.31% | -42.39% | -43.00% | 1 |
| Natural Gas | 2.27 | -10.00% | -43.40% | -43.74% | 1 |
| Gasoline | 1.37 | -0.05% | -36.25% | -33.51% | 1 |
| IAG Energy Inflation Index* | Strong Deflation | 1 | |||
| Food and Essentials | |||||
| Wheat | 520.00 | 1.56% | -3.03% | -28.23% | 2 |
| Corn | 381.25 | -1.68% | 1.80% | -34.83% | 3 |
| Soybeans | 887.50 | -0.45% | -14.99% | -28.43% | 1 |
| Orange Juice | 133.95 | 23.68% | -1.36% | -14.93% | 3 |
| Sugar | 14.52 | 12.82% | -9.25% | -50.44% | 2 |
| Live Cattle | 141.13 | 7.73% | -14.86% | 42.84% | 1 |
| Cocoa | 3252 | 4.23% | 12.14% | 15.94% | 5 |
| Coffee | 121.00 | -0.25% | -35.96% | -40.34% | 1 |
| Cotton | 63.34 | 5.04% | -1.69% | -49.65% | 3 |
| Stamps | $0.49 | 0.00% | 6.52% | 11.36% | 4 |
| CRB Foodstuffs Index | 365.90 | 1.70% | -7.95% | -12.50% | 2 |
| IAG Food and Essentials Inflation Index* | Mild Deflation | 2 | |||
| Construction and Manufacturing | |||||
| Copper | 2.31 | 2.04% | -24.19% | -38.47% | 1 |
| Lumber | 253.70 | 12.11% | -22.63% | -9.88% | 1 |
| Aluminum | 0.66 | -5.71% | -26.67% | -34.00% | 1 |
| CRB Raw Industrials | 413.56 | -4.82% | -18.37% | -24.32% | 1 |
| Total Construction Spending (M) | 1,094,160.00 | 0.61% | 14.07% | 33.80% | 5 |
| ISM Manufacturing Index | 50.10 | -0.20% | -13.47% | -13.17% | 1 |
| IAG Construction & Manufacturing Index* | Strong Deflation | 1 | |||
| Precious Metals | |||||
| Gold | 1,141.30 | 2.40% | -2.54% | -16.06% | 2 |
| Silver | 15.54 | 7.14% | -3.57% | -37.23% | 2 |
| IAG Precious Metals Inflation Index* | Mild Deflation | 2 | |||
| Innovative Advisory Group Index | |||||
| IAG Inflation Index Composite* | Mild/Strong Deflation | 1 / 2 | |||
* If you would like a description of terms, calculations, or concepts, please visit our Inflation monitor page to get additional supporting information. We will continually add to this page to provide supporting information.
* Our Inflation Score is based on a proprietary algorithm, which is meant to describe the respective category by a simple number. The scores range from 1-5. One (1) being the most deflationary. Five (5) being the most inflationary. These scores are meant to simplify each item and allow someone to quickly scan each item or section to see the degree of which inflation or deflation is present.
* We have also added our own indexes to each category to make it even easier for readers to receive a summary of information.
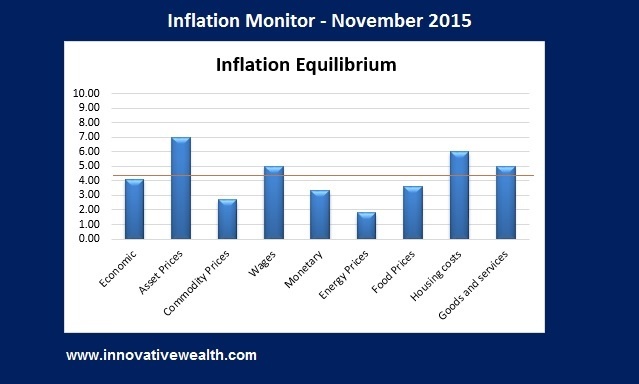
Inflation Monitor Summary – Composite Ranking
* The Inflation Equilibrium is a quick summary for the whole data series of the inflation monitor. If you don’t like statistics, this is the chart for you.
Inflation Monitor – November 2015 – Introduction
Looking at the past year I have to give a hearty laugh at the people to claim that the US Dollar is losing value. I wonder if these people own a computer, or have bothered to look at the US Dollar chart. It is included below along with the chart of gold (which is a long gold/short US Dollar trade) and a few other important assets.
The important thing to know about the US Dollar is that putting a value to it is complicated because it is a fiat currency. This means there are more than one moving variables that need to be accounted for to determine whether it is rising or falling in value.
Take gold for example. Gold is a chunk of metal. People put a price on it of what they are willing to pay for it, but that is it. Its price is only determined what someone with a specific currency is willing to pay for it. Pricing an asset like gold is easy. Prior to being removed from the gold standard, the US Dollar was pegged to the price of gold, so there was an easy relationship which could be determined.
Now lets take a look at the current version of the US Dollar in comparison. The US Dollar is a piece of paper, but also a whole lot more.
What is a US Dollar worth? You could compare it to the value of a hard asset like gold and find out how much gold you could get for a dollar. Another and more practical way is to compare it to another currency, like the Euro. As of today, one US Dollar is worth 0.93 Euros, 122.83 Yen, 0.65 British Pounds, 1.33 Canadian Dollars, 1.02 Swiss Franc, or 8.68 Swedish Krona.
To be more even more accurate, it is worth a combination of each of those currencies: 57.6% Euro, 13.6% Yen, 11.9% Pounds, 9.1% Canadian Dollars, 4.2% Swedish Krona, 3.6% Swiss Franc.
Each of these currencies fluctuates based on the economies of their respective countries. So not only is the value of the US Dollar moving, but it is moving in comparison to 6 different currencies which are also moving. It should be obvious why it is complicated to value the US Dollar.
There are some relationships that do occur with the US Dollar due to its status as global reserve currency that are worth noting.
- The US Dollar tends to move inversely to the price of commodities
- The US Dollar tends to become more valuable when people are selling other assets in favor of cash (as was the case in the fall of 2008)
- The US Dollar is a favorable place to store your assets when deflation exists.
While there are many people who will claim that the world is ending and the US Dollar will go to zero and you need to live in a cave with your gold and guns. You should realize that they are playing on your fears. Their logic might be sound, but the world has a habit of not ending.
That being said, there is a historical relationship between the value of the US Dollar and inflation. Inflation decreases the purchasing power of your cash. If you had $100 and held onto that cash for 100 years, It would be worth a small fraction of what was worth 100 years ago. However, this is assuming that you didn’t spend it or invest it into anything.
This relationship of the devaluing of your cash is due to inflation. Without inflation, this relationship does not take place. In fact, if we experience deflation, the value of your cash will actually increase in relation to everything else. If you did not experience the great depression in the 1920s and 30s, then you probably would not understand the relationship or what it means to have deflation. Only a small percent of the population was alive to have this experience.
If you have been following the Inflation Monitor for any length of time, you know that the trend is deflationary for almost all the categories we track. This means that holding US Dollars is a good thing right now.
Before I close out this intro section, I am going to suggest something that I hope you put some thought into. Check your presuppositions when it comes to investing. This includes the most basic building blocks on which you may have built your investing strategy. Take this one idea for example.
Many investors have been taught that buy and hold investing is the best way to invest. This was a solid strategy during the bull market of the 80s and 90s, but has not been a good strategy from 2000 till today. The decade from 2000-2009 produced 10 years of negative total returns for the S&P 500. The highest point of the S&P 500 was not bested until 2013. If you had invested in the S&P 500 at the highest point of 2000, it took you 13 years just to have a positive return on your investment. Just because something is true in the past, does not make it true in the future.
The same idea holds true for investing in real estate (which many people said never goes down prior to 2008), or tech stocks in the late 90s (for which earnings didn’t matter…until they did) or inflation which people laugh at the idea that deflation will ever happen again. It is interesting that some of the biggest problems happen when people fail to reassess their most basic assumptions.
As you will see above, inflation is not a certainty, and inflation has actually turned into deflation in many countries. The US is experiencing both inflation and deflation, the battle has not yet been decided, but I suspect we will continue to see defined movement in the direction of deflation. If you want to learn more about why this is the case, please read prior issues of the inflation monitor.
I hope you enjoy this month’s Inflation Monitor – November 2015.
Kirk Chisholm
As always, please contact me with any questions or to send your feedback. Thank you for reading.
Join our email list to receive the Inflation Monitor sent directly to your inbox.
Charts of the Month
Leading Indicators
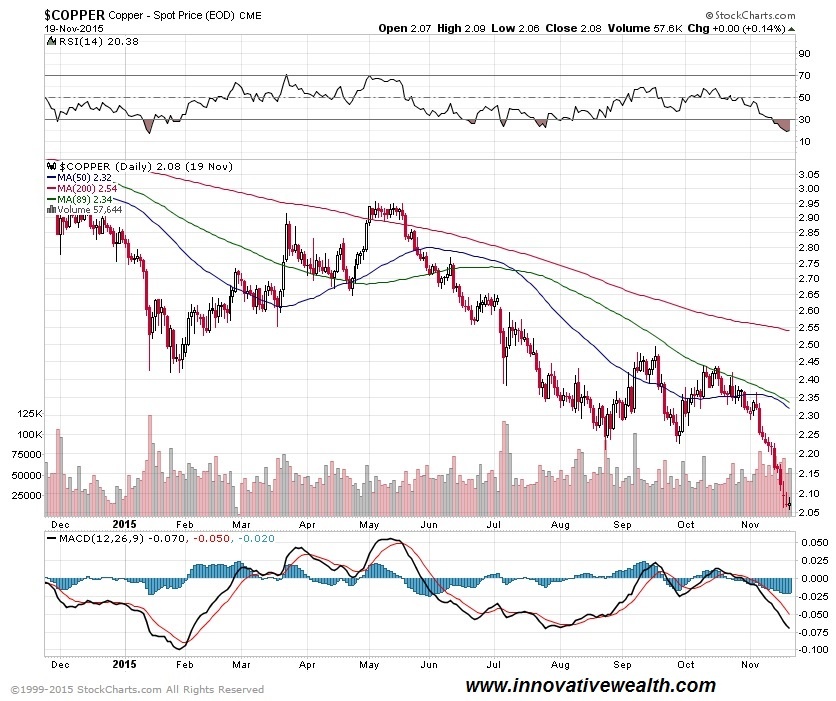
Dr. Copper
Dr. Copper is still weak. the down trend is continuing. At some point there will be a tremendous opportunity to buy this essential metal, but right now investors of copper are running for the exits.
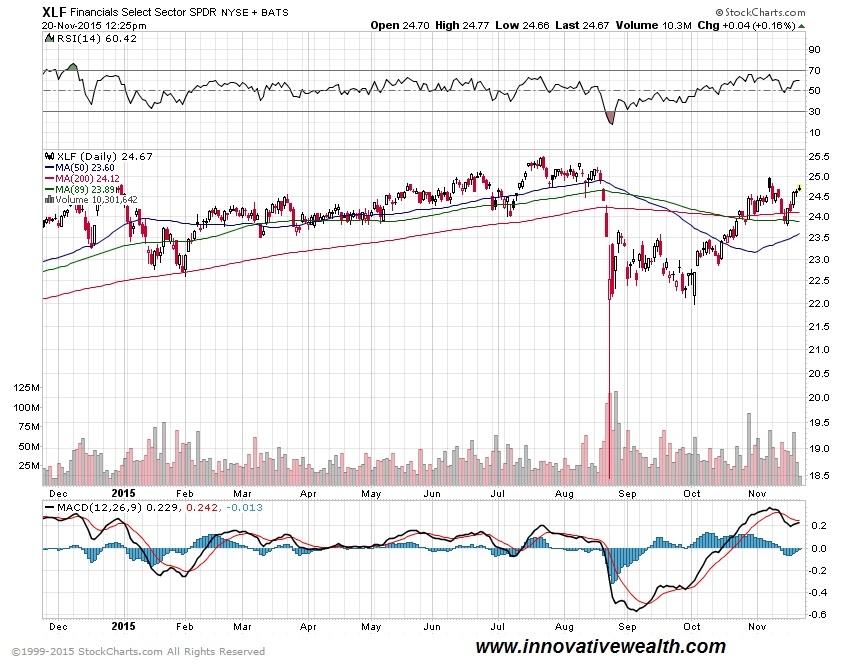
Financials
Financial are holding steady. If the Fed raises interest rates in December, that could help the financials, but I doubt they will raise rates much if at all, so the “help” might be insignificant with all the penalties, fee, fines, etc they are paying.
Consumer Price Ratio (CPI)
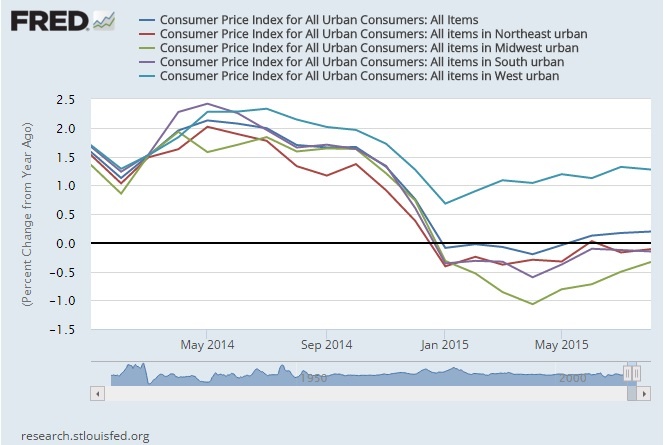
The CPI is flat for the year. If you have read this Inflation Monitor report for the last 12 months you will know that strong deflationary forces are here to stay. The Fed does not want deflation in the US, but can they stop it? We will find out soon enough what tricks they have up their sleeve.
If you think that the CPI doesn’t reflect the prices in your area, you might be correct. Here is the CPI for your area. Looks like the west is trying to elevate the other ares of the US.
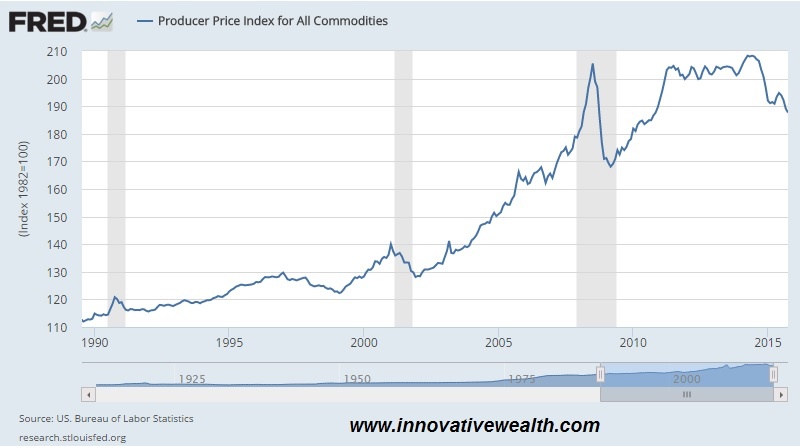
Producer Price Index (PPI)
The Producer Price Index is continuing to have a rough time this year. The declining PPI might be a reflection of the new economic conditions of producers and manufacturing with a high value of the US Dollar. This makes it harder for US companies to export goods since they will be about 20% more expensive from where they were last year.
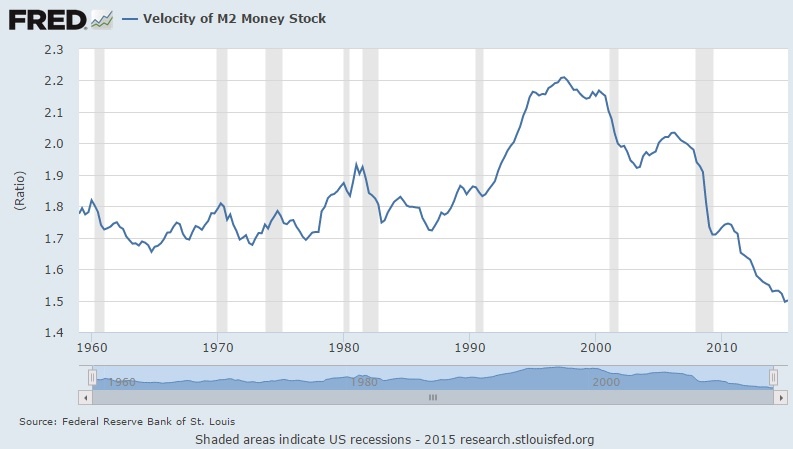
US Velocity of Money M2
This is a clear sign that inflation is not around the corner. Don’t bother even looking for it. Once again deflation is the active trend.
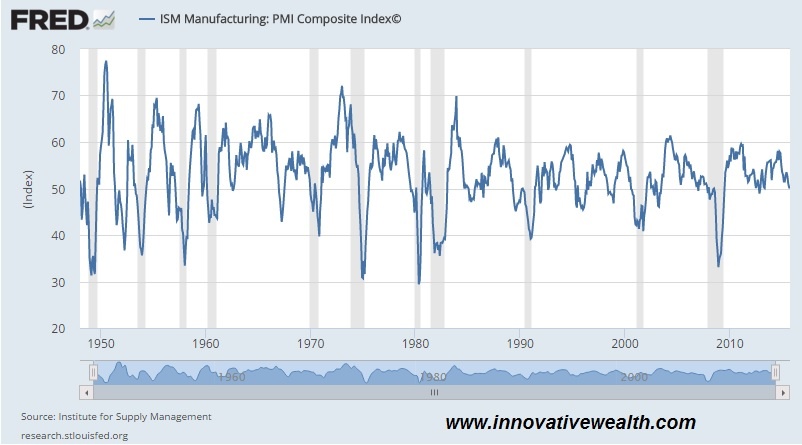
ISM Manufacturing
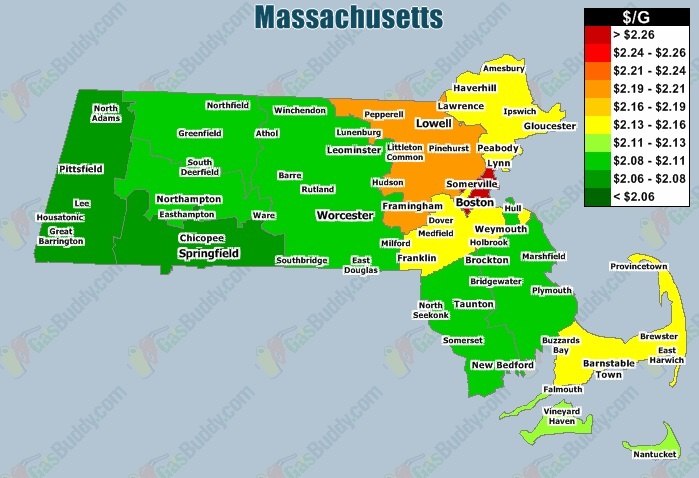
Gas Prices in Massachusetts
Gas prices have dropped to more reasonable levels, but I think we could still drop lower. Oil prices have already broken below the $30 lever earlier this year, I suspect they will continue lower. The world seems to be running out of oil storage. Oil producers seem intent to continue producing oil. What happens when they run out of storage? I guess if history is any lesson, now is the time the US government will announce that they will sell most of the US oil reserves. Nothing like timing the bottom of the market. They also tend to buy more when oil prices are high too. A great contrarian indicator if I ever saw one.
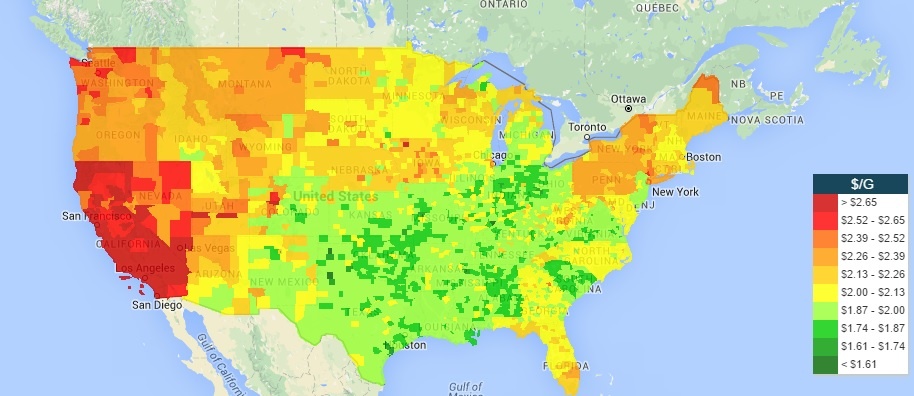
Gas Prices in the US
I’m perfectly fine not living in California.Not only do they have high gas prices, but they also are running out of water. I wonder which is cheaper in CA, water or gas…
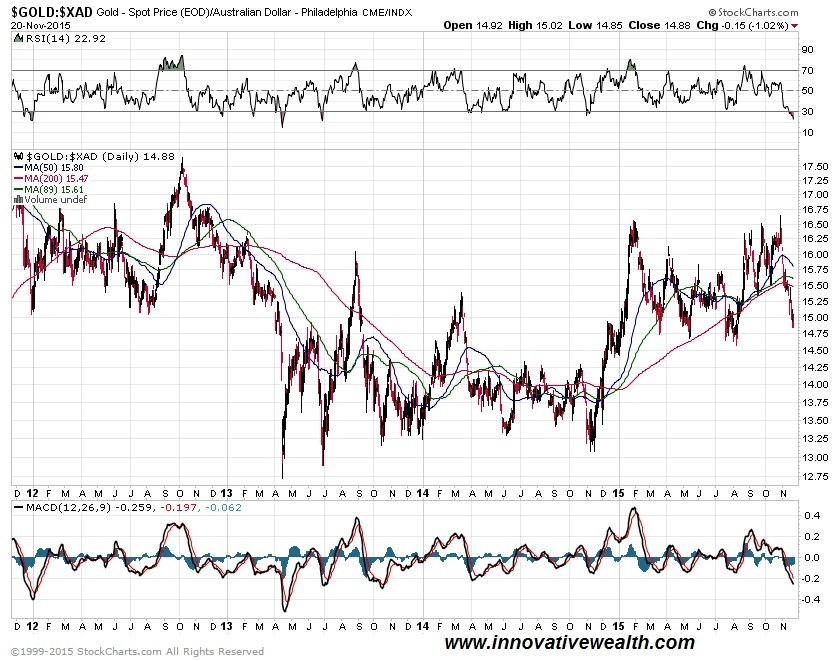
Currency Relative Valuations to Gold
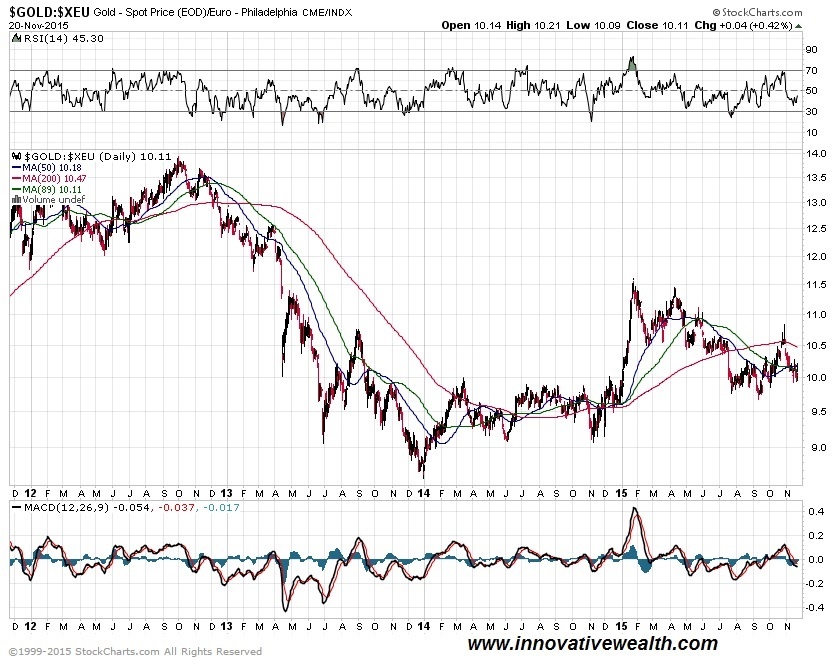
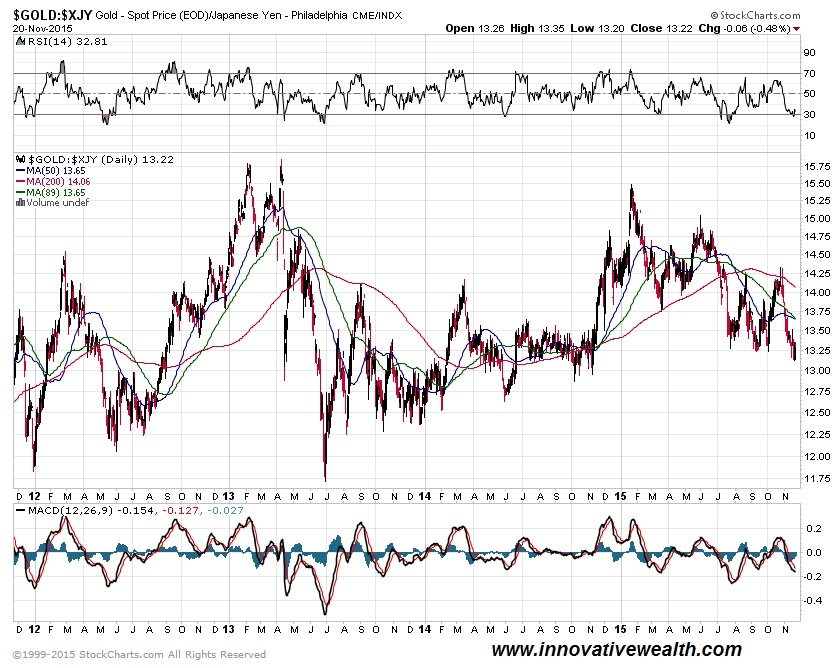
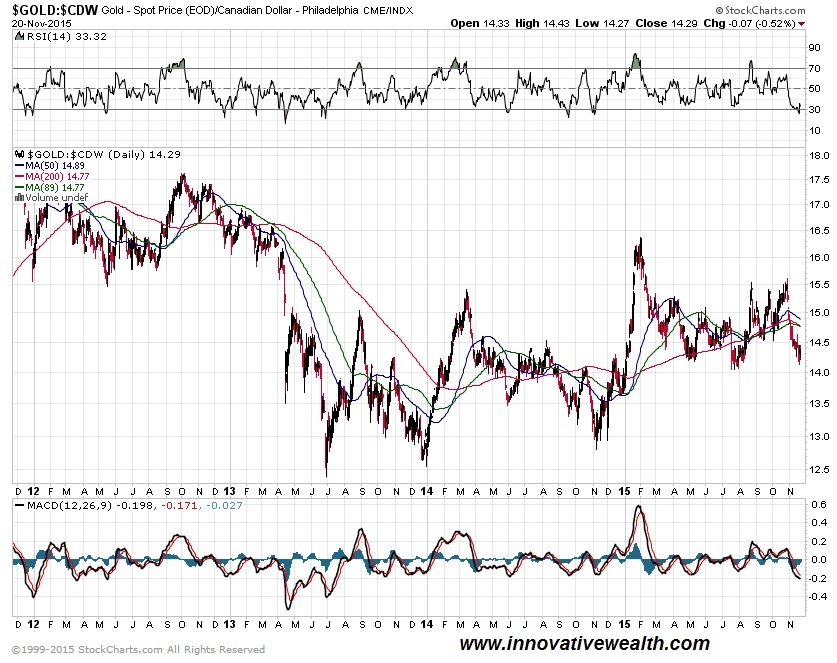
Gold is priced in the currency you use everyday. If you live in the European Union, you use Euros, if you live in Japan, you use Yen, and if you live in the US you use US dollars. Each of these currencies are used to buy gold in their respective countries, so we look at gold priced in each country to see how people value it in their own currency. This can tell us a lot about the demand for gold inside and outside the US.
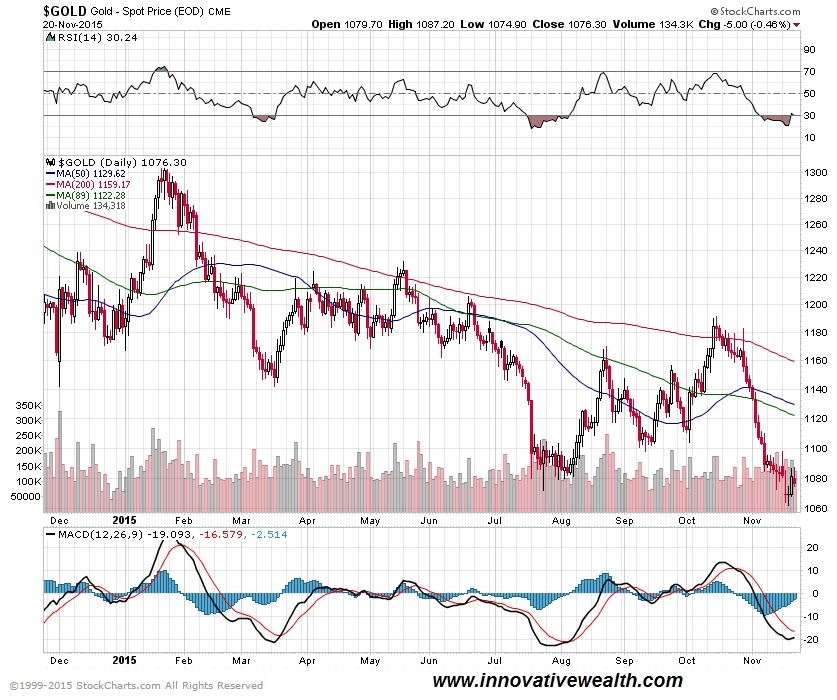
Gold prices are they strong or weak?
Gold Priced in Euros
Gold Priced in Yen
Gold Priced in Canadian Dollars
Gold Priced in Australian Dollars
Bonds
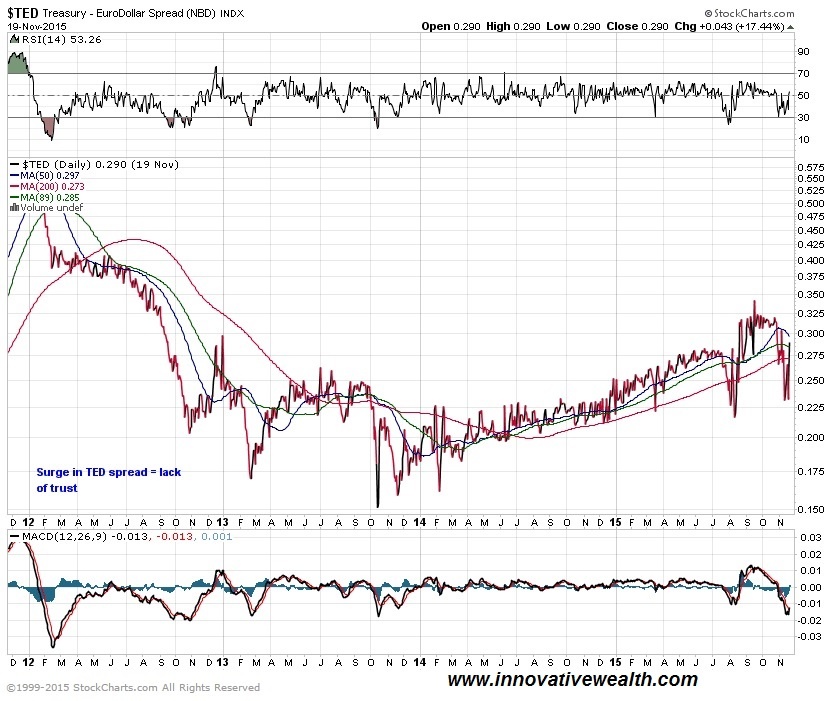
TED Spread
A surge in the Ted Spread means a lack of trust in financial institutions. This is not a good trend, although it is off low. It is far off the 2008 highs of 4.6, but the upward trend is not a good sign, since it is confirming many other indicators.
10 year vs. 2 year Treasury Spread
The flattening (or inverting) of the yield curve is not good for banks and also typically shows signs on a recession. It is probably one of the best indicators of a recession we have, yet no one knows the status since interest rates are stuck at zero.

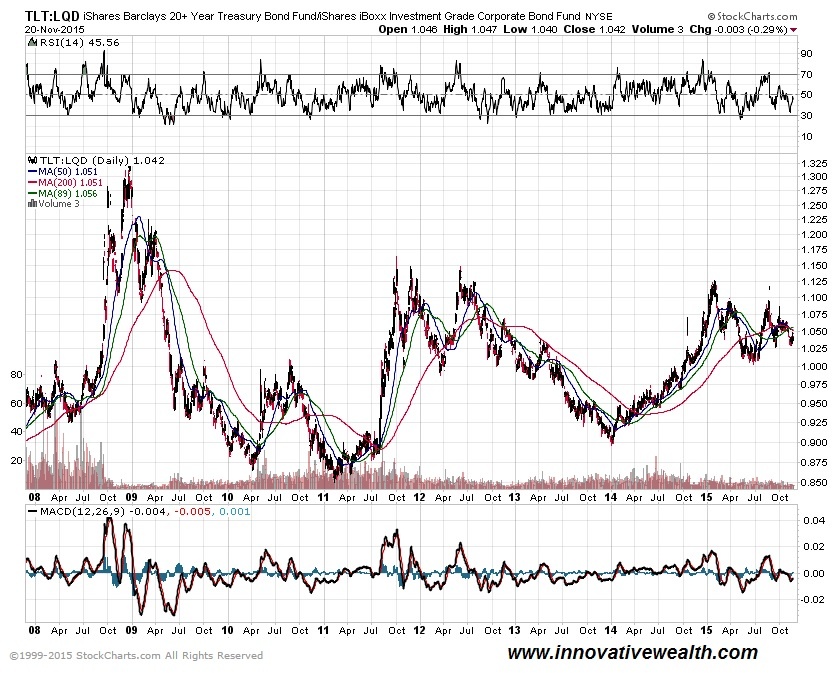
Treasury vs Corp Bond Spread
The spread between 30-year treasuries and corporate bonds is relatively high, as it can be in times of market distress. It will be interesting to see how this plays out as interest rates start to rise… assuming they ever do.
High Yield Bonds (Junk Bonds)
High yield bonds have had a good run of very low default rates. 2014 was around 1%. During recessions, these default rates tend to climb up to around 10% (1991, 2001, 2002, and 2009). This is fine unless you are getting 5% on your high yield bond income. In that case, you would net -5% a year. I’ll bet that is not quite what you had in mind when you were looking for income.
Jobs, Jobs, Jobs…
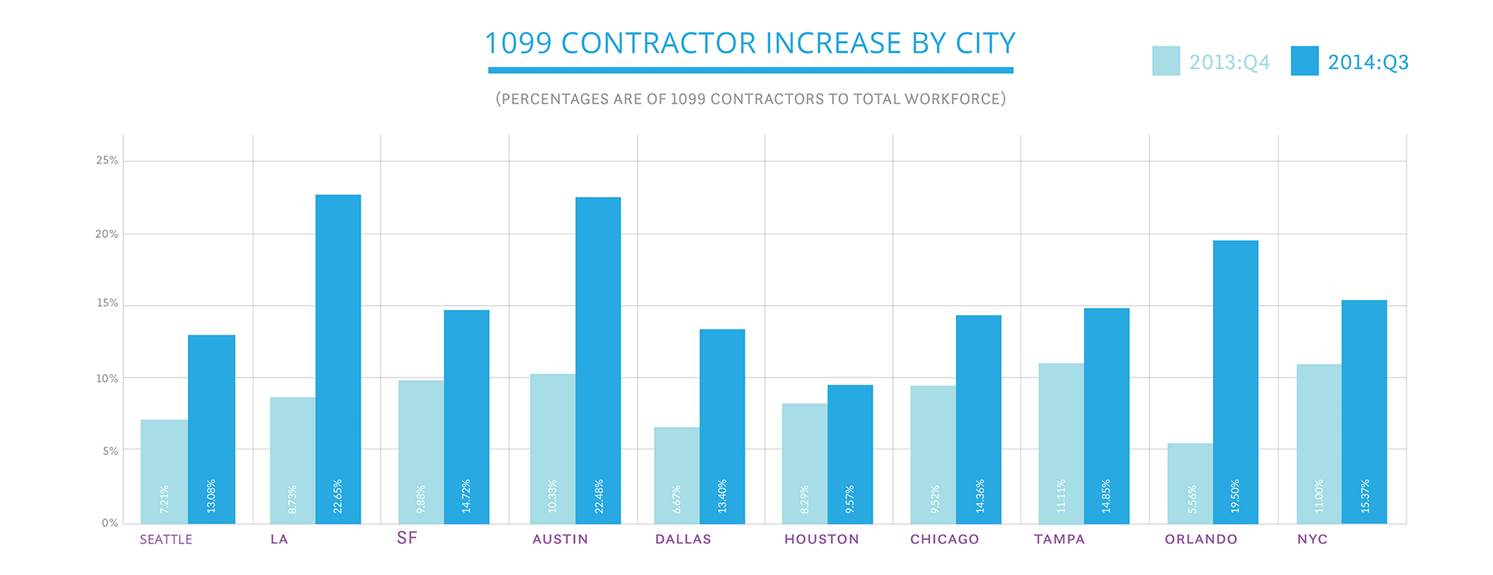
This trend may be more of a permanent trend that has little to do with the economic conditions and more to do with people being more interested in side hustles, or gigs.
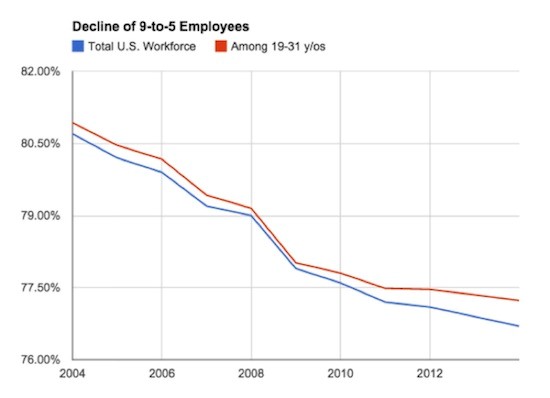
Being an employee is less attractive to people.

Working when you want is much more attractive to people.
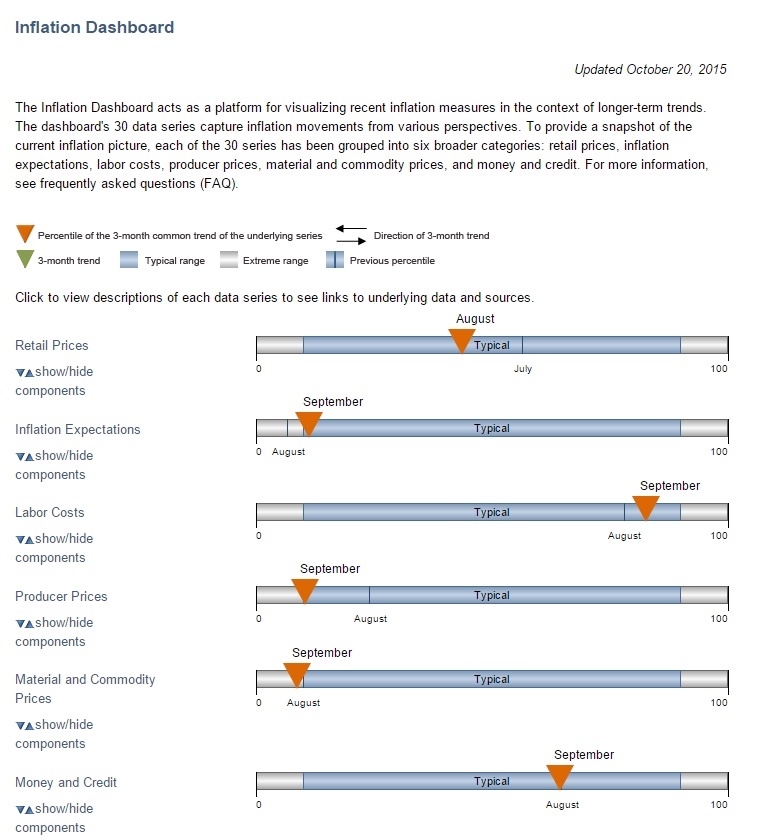
Inflation Dashboard
I like this view because it gives more of a visual perspective of the data presented above.
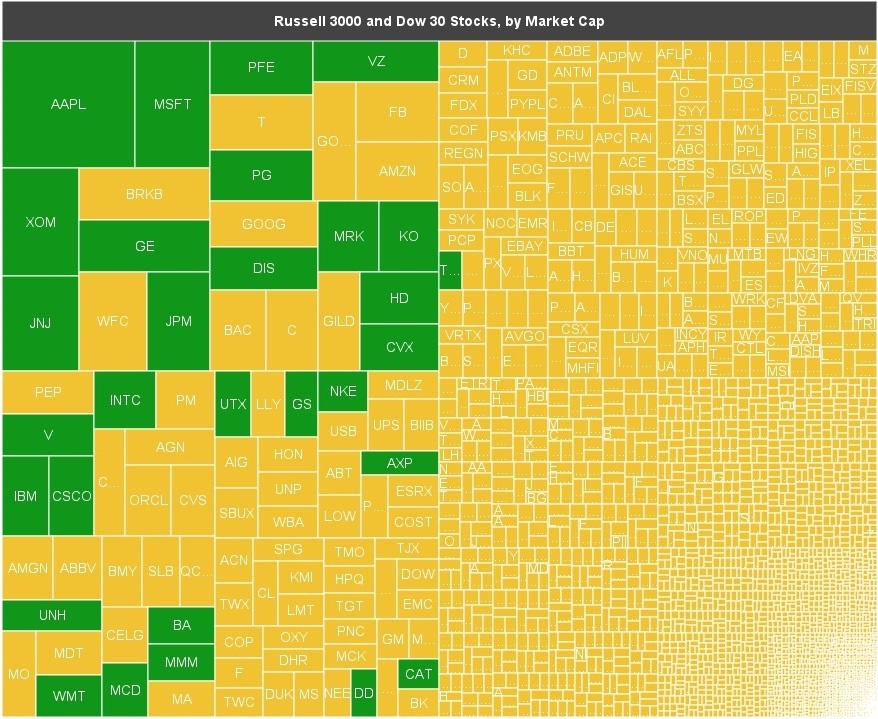
Why the Dow is a Terrible Index
I found this heat map of S&P 500 stocks where the Dow 30 are highlighted compared to the size of the stock market (S&P 500 stocks only). If it doesn’t make you laugh it should. Why is the Dow still an index?
I hope you enjoyed this month’s Inflation Monitor. See you next month.
Cheers,
Kirk Chisholm
The IAG Inflation Monitor – Subscription Service
We are initially publishing this Inflation Monitor as a free service to anyone who wishes to read it. We do not always expect this to be the case. Due to the high demand for us to publish this service from a wide variety of people who subscribe, we do at some point in the next 12 months expect to charge for this service. Our commitment to our wealth management clients is to always provide complimentary access to our research. If you would like to discuss becoming a wealth management client, feel free to contact us.
If you would like to automatically receive the Inflation Monitor in your email inbox each month, click here to join our free subscription service.
Sources:
- Federal Reserve – St. Louis
- U.S. Energy Information Administration
- U.S. Post Office
- National Association of Realtors
- The Economist
- The Commodity Research Bureau
- Gurufocus.com
- Stockcharts.com
- GasBuddy
* IAG index calculations are based on publicly available information.
** IAG Price Composite indexes are based on publicly available information.
About Innovative Advisory Group: Innovative Advisory Group, LLC (IAG), an independent Registered Investment Advisory Firm, is bringing innovation to the wealth management industry by combining both traditional and alternative investments. IAG is unique in that we have an extensive understanding of the regulatory and financial considerations involved with self-directed IRAs and other retirement accounts. IAG advises clients on traditional investments, such as stocks, bonds, and mutual funds, as well as advising clients on alternative investments. IAG has a value-oriented approach to investing, which integrates specialized investment experience with extensive resources.
For more information, you can visit: innovativewealth.com
About the author: Kirk Chisholm is a Wealth Manager and Principal at Innovative Advisory Group. His roles at IAG are co-chair of the Investment Committee and Head of the Traditional Investment Risk Management Group. His background and areas of focus are portfolio management and investment analysis in both the traditional and non-traditional investment markets. He received a BA degree in Economics from Trinity College in Hartford, CT.
Disclaimer: This article is intended solely for informational purposes only, and in no manner intended to solicit any product or service. The opinions in this article are exclusively of the author(s) and may or may not reflect all those who are employed, either directly or indirectly or affiliated with Innovative Advisory Group, LLC.

