
| Index | Value | 1mo change | 1yr change | 5yr change | Inflation Score |
|---|---|---|---|---|---|
| Economic Inflation | |||||
| Consumer Price Index (CPI) | 236.60 | 0.20% | -0.20% | 8.53% | 1 |
| Producer Price Index (PPI) | 190.7 | -0.47% | -8.45% | 3.42% | 1 |
| 1 Yr Treasury Bill Yield | 0.23% | -0.02 | 0.12 | -0.22 | 2 |
| 10 Yr Treasury Note Yield | 2.12% | 0.13 | -0.44 | -1.30 | 2 |
| Real Interest Rate | 0.43% | 0.11 | 2.27 | 2.22 | 3 |
| US 10 yr TIPS | 0.18% | 0.11 | -0.19 | -1.13 | 2 |
| Capacity utilization | 78.20 | -0.26% | -1.01% | 7.86% | 3 |
| Industrial Production Index | 105.18 | -0.04% | 1.93% | 17.86% | 4 |
| Personal Consumption Expenditure Index | 12,160.5 | 0.46% | 2.99% | 20.45% | 3 |
| Rogers International Commodity Index | 2745.22 | 7.60% | -0.14% | -16.53% | 3 |
| SSA COLA | 0.00% | 1.70% | 3 | ||
| Median Income | $51,939.00 | 1.81% | 3.25% | 3 | |
| Real Median Income | $51,939.00 | 0.35% | -4.56 | 3 | |
| Consumer Interest in Inflation | Stable | 3 | |||
| IAG Inflation Composite | Strong Deflation | 1 | |||
| US GDP | 17665.00 | -0.22% | 3.64% | 20.32% | 4 |
| S&P 500 | 2108.29 | 2.36% | 11.50% | 75.36% | 5 |
| Market Cap to GDP | 126.50% | 121.20% | 74.30% | 5 | |
| US Population | 320,887 | 0.06% | 0.73% | 4.04% | 2 |
| IAG Economic Inflation Index* | Mild Deflation | 2 | |||
| Housing Inflation | |||||
| Median Home price | 219,400.00 | 3.44% | 8.88% | 27.34% | 4 |
| 30Yr Mortgage Rate | 3.67% | -0.10 | -0.67 | -1.43 | 4 |
| Housing affordability | 170.30 | -5.07% | -1.66% | 2 | |
| US Median Rent | 799.00 | 4.31% | 16.64% | 4 | |
| IAG Housing Inflation Index* | Mild Inflation | 4 | |||
| Monetary Inflation | |||||
| US Govt debt held by Fed (B) | 2,793.40 | 0.94% | 26.47% | 259.70% | 1 |
| US Debt as a % of GDP (B) | 102.76% | 0.28% | -0.51% | 15.75% | 2 |
| M2 Money Stock (B) | 11,9275.10 | 0.41% | 6.05% | 39.62% | 4 |
| Monetary Base (B) | 4,075.38 | 0.27% | 3.12% | 100.01% | 3 |
| Outstanding US Gov’t Debt (B) | 18,152.056 | 0.06% | 3.13% | 42.11% | 4 |
| Total Credit Market Debt (B) | 58,715.58 | 1.27% | 3.58% | 12.50% | 4 |
| Velocity of Money [M2] | 1.50 | -2.09% | -2.41% | -13.56% | 1 |
| US Trade Balance | -51,367.00 | 43.12% | -20.06% | -29.17% | 1 |
| Big Mac Index | Expensive | 1 | |||
| US Dollar | 95.39 | -3.15% | 19.88% | 16.29% | 1 |
| IAG Monetary Inflation Index* | Mild Deflation | 2 | |||
| Energy | |||||
| Electricity (cents / KW hour) | 12.35 | 2.07% | 0.90% | 3 | |
| Coal (CAPP) | 52.85 | -0.40% | -12.76% | -18.19% | 1 |
| Oil | 59.79 | 25.90% | -40.04% | -30.65% | 1 |
| Natural Gas | 2.74 | 5.27% | -42.94% | -30.53% | 1 |
| Gasoline | 2.05 | 0.00% | -30.79% | -14.46% | 1 |
| IAG Energy Inflation Index* | Strong Deflation | 1 | |||
| Food and Essentials | |||||
| Wheat | 476.00 | -10.27% | -34.16% | -5.51% | 1 |
| Corn | 366.00 | -2.72% | -29.34% | -2.53% | 1 |
| Soybeans | 978.00 | 0.54% | -35.25% | -2.18% | 1 |
| Orange Juice | 116.05 | -6.79% | -27.74% | -16.18% | 1 |
| Sugar | 12.00 | -8.75 | -32.47% | -21.16% | 1 |
| Pork | 81.95 | 32.18% | -33.37% | -5.51% | 1 |
| Cocoa | 2966.00 | 9.69% | 0.00% | -8.32% | 3 |
| Coffee | 137.55 | -33.11% | -22.29% | 1.44% | 1 |
| Cotton | 68.00 | 7.77% | -27.80% | -19.22% | 1 |
| Stamps | $0.49 | 0.00% | 6.52% | 11.36% | 4 |
| CRB Foodstuffs Index | 355.79 | 2.33% | -20.64% | -2.81% | 1 |
| IAG Food and Essentials Inflation Index* | Strong Deflation | 1 | |||
| Construction and Manufacturing | |||||
| Copper | 2.89 | 5.29% | -4.39% | -14.26% | 2 |
| Lumber | 221.00 | 0.00% | -34.40% | -27.56% | 1 |
| Aluminum | 0.82 | -1.81% | -0.61% | -15.98% | 3 |
| CRB Raw Industrials | 473.36 | 1.03% | -12.84% | -6.88% | 1 |
| Total Construction Spending (M) | 966,561.00 | -0.06% | 2.03% | 13.33% | 3 |
| ISM Manufacturing Index | 51.50 | 0.00% | -6.87% | -11.36% | 1 |
| IAG Construction & Manufacturing Index* | Mild Deflation | 2 | |||
| Precious Metals | |||||
| Gold | 1,183.70 | -0.15% | -8.38% | 0.25% | 1 |
| Silver | 16.62 | 2.94% | -13.39% | -10.93% | 1 |
| IAG Precious Metals Inflation Index* | Strong Deflation | 1 | |||
| Innovative Advisory Group Index | |||||
| IAG Inflation Index Composite* | Mild/Strong Deflation | 1 / 2 | |||
* If you would like a description of terms, calculations, or concepts, please visit our Inflation monitor page to get additional supporting information. We will continually add to this page to provide supporting information.
* Our Inflation Score is based on a proprietary algorithm, which is meant to describe the respective category by a simple number. The scores range from 1-5. One (1) being the most deflationary. Five (5) being the most inflationary. These scores are meant to simplify each item and allow someone to quickly scan each item or section to see the degree of which inflation or deflation is present.
* We have also added our own indexes to each category to make it even easier for readers to receive a summary of information.
Inflation Monitor Summary – Composite Ranking

* The Inflation Equilibrium is a quick summary for the whole data series of the inflation monitor. If you don’t like statistics, this is the chart for you.
Inflation Monitor – May 2015 – Introduction
This month we were a bit slow getting this out due to some website upgrades. We expect that this June version of the Inflation Monitor will be out in 2 weeks so you will get a double dose of information.
May was a month of mixed results. Some data is showing some signs of life with inflation, but others show the decline of inflation continues… albeit slowly. Based on my estimates,2 Q3 and Q4 of this year should start to show some signs of economic slowdown. While we have started to see this in the earnings numbers, due to a lot of the hedging done by large public companies, the earnings may be less impressive when those hedges expire.
The quick rise in the US Dollar and lack of QE in the US may be too much for the US economy to handle. It typically takes a few months before these effects filter down into the economy. But I expect later this year to see the results of those changes. There are many interesting data points to consider, but the PPI is one of the most interesting this month.
Other issues which are concerning…
The effects of debt have been slowly accumulating in the US over time and have put an increasing amount of weight on the growth of the US economy. It is hard to grow out of a recession when a large amount of your revenues go to paying off interest on your debt. Maybe this can put some perspective on the balance sheet of the US.
According to the GAO, the US has net worth of -17.7T, which is higher than the -16.9T last year. If you include the 42T in unfunded liabilities, this brings the total net worth of the US to -60T. That is not small amount of money to pay back. This is a little over $188,000 per person in liabilities. I think it is unlikely that this will get paid back in anything but inflation. What if the US cannot inflate away their debts like other countries have in the past? That will put the US in an interesting position. The available options are not pretty.
While there is constant discussion about how big of a problem this it… and it is, the reality is that this won’t be a problem until it is. By this I mean that the US, as the world’s reserve currency, has a special position in that they cannot default on their debt unless they choose to. Other countries do not have that luxury.
As long as the US Dollar is desirable to the rest of the world, we can continue to play this charade as long as we want. Then one day that will change and we will be in trouble. Until then, party like its 1999.
Enjoy this month’s Inflation Monitor – May 2015.
As always, please contact me with any questions or to send your feedback. Thank you for reading.
Join our email list to receive the Inflation Monitor sent directly to your inbox.
![]()
Kirk Chisholm
Charts of the Month
Canada Real Estate Bubble
You better think twice before you buy real estate in Canada… It makes the US housing bubble look like amateur hour. There seems to be a lot of Chinese money flooding into Canadian real estate.

Australian Housing Bubble
This chart from Australian TV shows that housing prices have skyrocketed compared to incomes. Just like in Canada, it is only a matter of time before the two lines revert to the middle. Either income will have to rise or house prices will fall. I’m guessing on the later.

Median Income vs Mean Income in US

Asset Performance Expectations
This chart is put out by GMO periodically. This does not look good for the performance of asset prices in the future.

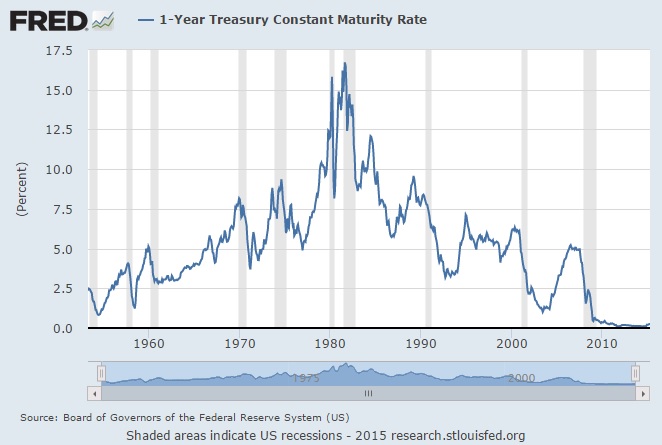
This one highlights the effect that rates of inflation can have on PE ratios… at least historically.
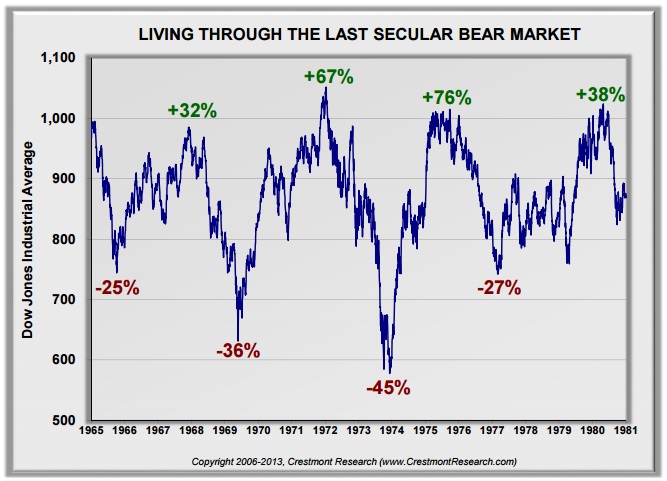
The stock market moves in cycles. the market is still expensive, but mostly due to low-interest rates.

The bear market cycle we are in looks a bit like the one in the 1960s-1970s. Lots of ups and downs, but essentially going nowhere.
Europe
Are you worried about the Grexit, the Brexit, or some other catchy name? Apparently, most people are less worried than you might think.

Gas Prices in Massachusetts
Massachusetts gas prices are back on the rise.

Gas Prices in the US

You can see how out of touch California is compared to the rest of the US… in many ways. I could not find a water map, but I did manage to find this interesting chart.

Gas Prices in Massachusetts

Automotive Jobs in US

Currency Relative Valuations to Gold
Gold prices are they strong or weak?

Gold Priced in Euros

Gold Priced in Yen

Gold Priced in Canadian Dollars

Gold Priced in Australian Dollars

Bonds
US Treasuries
Dow / Gold Ratio – 200 years

Baltic Dry Index
The Baltic Dry Index has picked up in the past month, but it still has a long way to go.

Capacity Utilization
This could be an ominous sign of things to come.

Producer Price Index (PPI)
This is also a foreboding chart.

I hope you enjoyed this month’s Inflation Monitor. See you next month.
Cheers,
![]()
Kirk Chisholm
The IAG Inflation Monitor – Subscription Service
We are initially publishing this Inflation Monitor as a free service to anyone who wishes to read it. We do not always expect this to be the case. Due to the high demand for us to publish this service, we plan to offer it free for a while and when we feel we have fine tuned it enough, we do plan on charging for access. Our commitment to our wealth management clients is to always provide complimentary access to our research. If you would like to discuss becoming a wealth management client, feel free to contact us.
If you would like to automatically receive the Inflation Monitor in your email inbox each month, click here to join our free subscription service.
![]()
Sources:
- Federal Reserve – St. Louis
- U.S. Energy Information Administration
- U.S. Post Office
- National Association of Realtors
- The Economist
- The Commodity Research Bureau
- Gurufocus.com
- Stockcharts.com
- GasBuddy
- GMO
* IAG index calculations are based on publicly available information.
** IAG Price Composite indexes are based on publicly available information.
About Innovative Advisory Group: Innovative Advisory Group, LLC (IAG), an independent Registered Investment Advisory Firm, is bringing innovation to the wealth management industry by combining both traditional and alternative investments. IAG is unique in that we have an extensive understanding of the regulatory and financial considerations involved with self-directed IRAs and other retirement accounts. IAG advises clients on traditional investments, such as stocks, bonds, and mutual funds, as well as advising clients on alternative investments. IAG has a value-oriented approach to investing, which integrates specialized investment experience with extensive resources.
For more information, you can visit: innovativewealth.com
About the author: Kirk Chisholm is a Wealth Manager and Principal at Innovative Advisory Group. His roles at IAG are co-chair of the Investment Committee and Head of the Traditional Investment Risk Management Group. His background and areas of focus are portfolio management and investment analysis in both the traditional and non-traditional investment markets. He received a BA degree in Economics from Trinity College in Hartford, CT.
Disclaimer: This article is intended solely for informational purposes only, and in no manner intended to solicit any product or service. The opinions in this article are exclusively of the author(s) and may or may not reflect all those who are employed, either directly or indirectly or affiliated with Innovative Advisory Group, LLC.