
| Index | Value | 1mo change | 1yr change | 5yr change | Inflation Score |
|---|---|---|---|---|---|
| Economic Inflation | |||||
| Consumer Price Index (CPI) | 237.81 | 0.51% | -0.04% | 9.00% | 1 |
| Producer Price Index (PPI) | 192.9 | 1.15% | -7.26% | 4.38% | 1 |
| 1 Yr Treasury Bill Yield | 0.24% | 0.01 | 0.14 | -0.13 | 2 |
| 10 Yr Treasury Note Yield | 2.42% | 0.14 | -0.18 | -0.78 | 2 |
| Real Interest Rate | 0.28% | -0.15 | 2.31 | 1.93 | 4 |
| US 10 yr TIPS | 0.50% | 0.32 | 0.13 | -0.76 | 2 |
| Capacity utilization | 78.10 | -0.13% | -1.26% | 5.83% | 2 |
| Industrial Production Index | 105.10 | -0.07% | 1.37% | 15.96% | 3 |
| Personal Consumption Expenditure Index | 12,295.01 | 1.11% | 3.97% | 21.65% | 3 |
| Rogers International Commodity Index | 2678.97 | -2.41% | -2.55% | -9.16% | 3 |
| SSA COLA | 0.00% | 1.70% | 3 | ||
| Median Income | $51,939.00 | 1.81% | 3.25% | 3 | |
| Real Median Income | $51,939.00 | 0.35% | -4.56% | 3 | |
| Consumer Interest in Inflation | Stable | 3 | |||
| IAG Inflation Composite | Strong Deflation | 1 | |||
| US GDP | 17693.30 | 0.16% | 2.11% | 18.84% | 3 |
| S&P 500 | 2108.58 | -0.16% | 8.29% | 94.63% | 5 |
| Market Cap to GDP | 125.70% | 121.20% | 74.30% | 5 | |
| US Population | 321,062 | 0.05% | 0.73% | 4.03% | 2 |
| IAG Economic Inflation Index* | Mild Deflation | 2 | |||
| Housing Inflation | |||||
| Median Home price | 228,700.00 | 4.24% | 7.88% | 30.99% | 4 |
| 30Yr Mortgage Rate | 3.84% | 0.17 | -0.35 | -1.05 | 4 |
| Housing affordability | 164.90 | -3.90% | -2.19% | 2 | |
| US Median Rent | 799.00 | 4.31% | 16.64% | 4 | |
| IAG Housing Inflation Index* | Mild Inflation | 4 | |||
| Monetary Inflation | |||||
| US Govt debt held by Fed (B) | 2,793.40 | 0.94% | 26.47% | 259.70% | 1 |
| US Debt as a % of GDP (B) | 102.59% | -0.16% | 0.84% | 13.92% | 2 |
| M2 Money Stock (B) | 11,889.2 | -0.72% | 5.83% | 38.91% | 4 |
| Monetary Base (B) | 3,955.23 | -2.95% | 0.67% | 94.57% | 3 |
| Outstanding US Gov’t Debt (B) | 18,152.056 | 0.06% | 3.13% | 42.11% | 4 |
| Total Credit Market Debt (B) | 59,045.73 | 0.56% | 3.42% | 14.00% | 4 |
| Velocity of Money [M2] | 1.50 | 0.13% | -2.41% | -13.74% | 1 |
| US Trade Balance | -40,879.00 | 20.42% | 10.32% | -0.04% | 1 |
| Big Mac Index | Expensive | 1 | |||
| US Dollar | 96.99 | 1.68% | 20.58% | 11.91% | 1 |
| IAG Monetary Inflation Index* | Mild Deflation | 2 | |||
| Energy | |||||
| Electricity (cents / KW hour) | 12.35 | 2.07% | 0.90% | 3 | |
| Coal (CAPP) | 52.75 | -0.58% | -12.93% | -18.34% | 1 |
| Oil | 60.73 | 27.88% | -39.10% | -29.56% | 1 |
| Natural Gas | 2.89 | 11.23% | -39.71% | -26.60% | 1 |
| Gasoline | 2.14 | 4.29% | -27.82% | -10.79% | 1 |
| IAG Energy Inflation Index* | Strong Deflation | 1 | |||
| Food and Essentials | |||||
| Wheat | 512.63 | -3.37% | -29.10% | 1.76% | 1 |
| Corn | 357.13 | -5.08% | -31.06% | -4.89% | 1 |
| Soybeans | 949.38 | -2.40% | -37.15% | -5.04% | 1 |
| Orange Juice | 121.93 | -2.06% | -24.08% | -11.93% | 1 |
| Sugar | 12.01 | -8.67 | -32.41% | -21.09% | 1 |
| Live Cattle | 152.58 | 1.87% | 10.84% | 71.05% | 3 |
| Cocoa | 3116.50 | 15.26% | 5.07% | -3.66% | 4 |
| Coffee | 136.08 | -33.83% | -23.12% | 0.35% | 1 |
| Cotton | 64.99 | 3.00% | -30.99% | -22.80% | 1 |
| Stamps | $0.49 | 0.00% | 6.52% | 11.36% | 4 |
| CRB Foodstuffs Index | 369.98 | 6.41% | -17.47% | 1.06% | 1 |
| IAG Food and Essentials Inflation Index* | Strong Deflation | 1 | |||
| Construction and Manufacturing | |||||
| Copper | 2.75 | 0.22% | -9.00% | -18.40% | 2 |
| Lumber | 296.00 | 33.94% | -12.14% | -2.98% | 1 |
| Aluminum | 0.77 | -7.23% | -6.10% | -20.62% | 2 |
| CRB Raw Industrials | 470.17 | 0.35% | -13.42% | -7.51% | 1 |
| Total Construction Spending (M) | 1,006,060.00 | 4.09% | 4.76% | 20.85% | 4 |
| ISM Manufacturing Index | 52.80 | 2.52% | -5.04% | -9.43% | 2 |
| IAG Construction & Manufacturing Index* | Mild Deflation | 2 | |||
| Precious Metals | |||||
| Gold | 1,185.70 | 0.02% | -8.22% | 0.42% | 2 |
| Silver | 15.96 | -1.13% | -16.82% | -14.45% | 1 |
| IAG Precious Metals Inflation Index* | Strong Deflation | 1 | |||
| Innovative Advisory Group Index | |||||
| IAG Inflation Index Composite* | Mild/Strong Deflation | 1 / 2 | |||
* If you would like a description of terms, calculations, or concepts, please visit our Inflation monitor page to get additional supporting information. We will continually add to this page to provide supporting information.
* Our Inflation Score is based on a proprietary algorithm, which is meant to describe the respective category by a simple number. The scores range from 1-5. One (1) being the most deflationary. Five (5) being the most inflationary. These scores are meant to simplify each item and allow someone to quickly scan each item or section to see the degree of which inflation or deflation is present.
* We have also added our own indexes to each category to make it even easier for readers to receive a summary of information.
Inflation Monitor Summary – Composite Ranking

* The Inflation Equilibrium is a quick summary for the whole data series of the inflation monitor. If you don’t like statistics, this is the chart for you.
Inflation Monitor – June 2015 – Introduction
It is officially summer and most markets are becoming more quite. This is of course excluding the ongoing crisis in Greece. They must love the attention because they have been dragging out this “crisis” since 2011. Everyone involved in this mess (on both sides) has a reason to kick the can down the road forever, but forever will not last that long. Greece has call for a referendum vote from the people. We will find out what the people want next week.
While the US markets have been quiet, there have been some disturbing signs cropping up in some of the economic indicators that we follow. These are: the velocity of money, PPI, and market cap to GDP. While many of the numbers listed above show deflation, these three are especially concerning. One interesting and potentially inflationary sign is a sharp pickup of the Baltic dry Index.
Enjoy this month’s Inflation Monitor – June 2015.
Kirk Chisholm
As always, please contact me with any questions or to send your feedback. Thank you for reading.
Join our email list to receive the Inflation Monitor sent directly to your inbox.
![]()
Charts of the Month
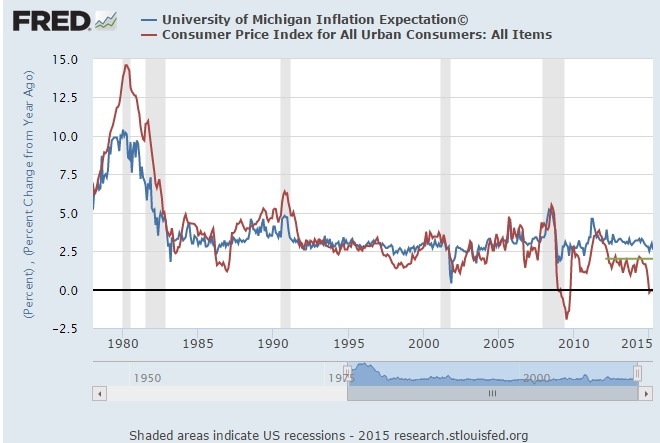
Inflation Expectations Vs Actual Inflation
We will start the charts off with one from the FRED blog. This one compares actual inflation with the expected inflation by the public. If you have been reading this Inflation Monitor for a while, you know that inflation is less important than inflation expectations. The expectations of the consumer tends to reinforce the current trend.
Leading Indicators
Dr. Copper
Dr. Copper is still weak. There is too much global supply of copper for this to get much traction. However, this seems to be true for many commodities.

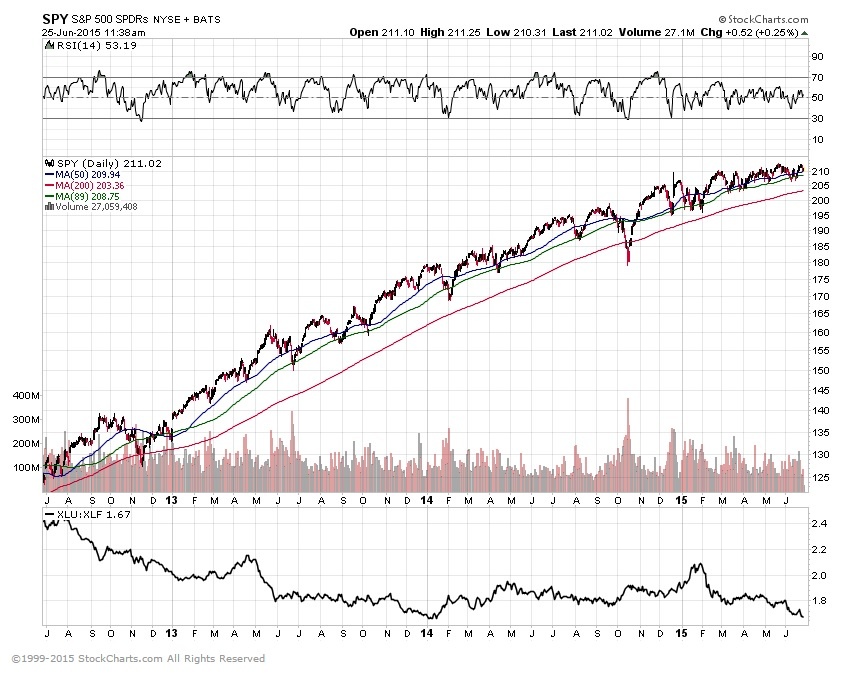
Financials
Financial are still going strong.

The bottom XLU to XLF ratio tends to rise in times of uncertainty. Although a rising rate environment may be skewing it away from utilities.
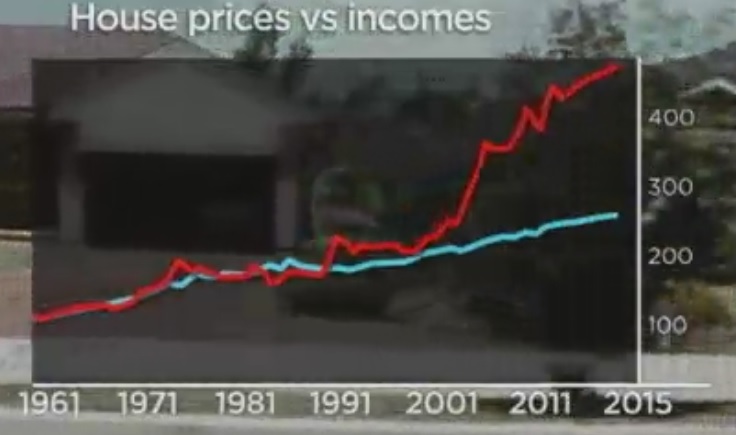
US House Prices

This Ratio is based on median household incomes and median home prices.. I have compared Boston to the 3 most expensive cities. The other end of the spectrum was Detroit, MI, Saginaw, MI, and Decatur, IL.
Jobs– Union Membership Trends
As of 1964 this is what percentage of union jobs the country had

As of 2014, this is the number of union jobs the country had.

I can’t say that I’m surprised. The US has become more of a service economy than a manufacturing economy. I’m sure when the TPP trade agreement is passed, more union jobs will disappear as well. Of course, that is just speculation. I couldn’t possibly know what is in the bill… that would be illegal. However, if it is anything like NAFTA, this trade agreement will also be a problem for unions.
PPI vs CPI
Not a good sign when the PPI turns down. At least it took a breather this past month. We will find out soon if that trend is going to continue.

Consumer Price Ratio (CPI)

Europe
Are you worried about the Grexit, the Brexit, Frexit, or some other catchy name? Apparently, most people are less worried than you might think. Maybe the public is finally realizing what the politicians already know… This is all political theater. The can will be kicked again.

China
Apparently, no one is worried about China. Am I the only one? The problems seem very obvious to me.

Gas Prices in Massachusetts
Massachusetts gas prices look like they are falling if you compare colors from this month and last, but it is hard to tell when the price scale changes. The top of the scale stayed the same and the bottom rose $0.08. Gas prices should be continuing to drop, but they are not. Regardless, in the past month gas prices have continued to rise.

Gas Prices in the US
California is still out of touch with the rest of the country. I guess that may always be true. The price scale for the US map has changed from last month as well, so don’t compare the colors.

Food Stamps (SNAP) in 5 states including Massachusetts
This trend also holds true for most of the other states as well. I cannot say that I am surprised. I suppose when these numbers start to decline, it might be a good sign the economy is on a solid footing.

Currency Relative Valuations to Gold
Gold prices are they strong or weak?

Gold Priced in Euros

Gold Priced in Yen

Gold Priced in Canadian Dollars

Gold Priced in Australian Dollars

Bonds
US Treasuries

Baltic Dry Index
The Baltic Dry Index has picked up in the past month, but it still has a long way to go. Could this be a sign of life?

Capacity Utilization
Still no signs of slowing…

I hope you enjoyed this month’s Inflation Monitor. See you next month.
Cheers,
![]()
Kirk Chisholm
The IAG Inflation Monitor – Subscription Service
We are initially publishing this Inflation Monitor as a free service to anyone who wishes to read it. We do not always expect this to be the case. Due to the high demand for us to publish this service, we plan to offer it free for a while and when we feel we have fine tuned it enough, we do plan on charging for access. Our commitment to our wealth management clients is to always provide complimentary access to our research. If you would like to discuss becoming a wealth management client, feel free to contact us.
If you would like to automatically receive the Inflation Monitor in your email inbox each month, click here to join our free subscription service.
![]()
Sources:
- Federal Reserve – St. Louis
- U.S. Energy Information Administration
- U.S. Post Office
- National Association of Realtors
- The Economist
- The Commodity Research Bureau
- Gurufocus.com
- Stockcharts.com
- GasBuddy
* IAG index calculations are based on publicly available information.
** IAG Price Composite indexes are based on publicly available information.
About Innovative Advisory Group: Innovative Advisory Group, LLC (IAG), an independent Registered Investment Advisory Firm, is bringing innovation to the wealth management industry by combining both traditional and alternative investments. IAG is unique in that we have an extensive understanding of the regulatory and financial considerations involved with self-directed IRAs and other retirement accounts. IAG advises clients on traditional investments, such as stocks, bonds, and mutual funds, as well as advising clients on alternative investments. IAG has a value-oriented approach to investing, which integrates specialized investment experience with extensive resources.
For more information, you can visit: innovativewealth.com
About the author: Kirk Chisholm is a Wealth Manager and Principal at Innovative Advisory Group. His roles at IAG are co-chair of the Investment Committee and Head of the Traditional Investment Risk Management Group. His background and areas of focus are portfolio management and investment analysis in both the traditional and non-traditional investment markets. He received a BA degree in Economics from Trinity College in Hartford, CT.
Disclaimer: This article is intended solely for informational purposes only, and in no manner intended to solicit any product or service. The opinions in this article are exclusively of the author(s) and may or may not reflect all those who are employed, either directly or indirectly or affiliated with Innovative Advisory Group, LLC.