| Index | Value | 1mo change | 1yr change | 5yr change | Inflation Score |
|---|---|---|---|---|---|
| Economic Inflation | |||||
| Consumer Price Index (CPI) | 234.81 | -0.57% | 0.76% | 8.73% | 2 |
| Producer Price Index (PPI) | 197.60 | -1.79% | -2.18% | 10.95% | 1 |
| 1 Yr Treasury Bill Yield | 0.20% | -0.01 | 0.08 | -0.15 | 2 |
| 10 Yr Treasury Note Yield | 1.68% | -0.21 | -1.03 | -2.01 | 4 |
| Real Interest Rate | -0.55% | 0.65 | 0.83 | 1.80 | 4 |
| US 10 yr TIPS | 0.03% | -0.38 | -0.52 | -1.39 | 2 |
| ISM Manufacturing Index | 53.50 | -2.90% | 3.28% | -6.47% | 3 |
| Capacity utilization | 79.70 | -0.50% | 1.53% | 13.86% | 4 |
| Industrial Production Index | 106.51 | -0.14% | 4.88% | 22.53% | 4 |
| Personal Consumption Expenditure Index | 12,105.20 | -0.33% | 3.58% | 21.04% | 4 |
| Rogers International Commodity Index | 2600.69 | -5.40% | -26.41% | -13.75% | 1 |
| SSA COLA | 0.00% | 1.70% | 3 | ||
| Median Income | $51,939.00 | 1.81% | 3.25% | 3 | |
| Real Median Income | $51,939.00 | 0.35% | -4.56 | 3 | |
| Consumer Interest in Inflation | Mild interest in Deflation | 2 | |||
| IAG Inflation Composite | Mild Deflation | 2 | |||
| IAG Online Price Index | -1.59% | -0.69% | 9.90% | 1 | |
| US GDP | 17710.70 | 0.63% | 3.70% | 21.62% | 4 |
| S&P 500 | 2020.85 | -0.25% | 16.10% | 85.45% | 5 |
| Market Cap to GDP | 123.90% | 115.30% | 90.10% | 5 | |
| US Population | 320,367 | 0.05% | 0.73 | 4.12% | 2 |
| IAG Economic Inflation Index* | Mild Deflation | 2 | |||
| Housing Inflation | |||||
| Median Home price | 209,500.00 | 2.05% | 5.97% | 22.73% | 4 |
| 30Yr Mortgage Rate | 3.71% | -0.15 | -0.72 | -1.32 | 4 |
| Housing affordability | 167.80 | -1.00% | -1.64% | 2 | |
| US Median Rent | 766.00 | 2.68% | 12.65% | 3 | |
| IAG Housing Inflation Index* | Stable | 3 | |||
| Monetary Inflation | |||||
| US Govt debt held by Fed (B) | 2,705.90 | 3.49% | 39.72% | 312.17% | 1 |
| US Debt as a % of GDP (B) | 101.27% | -0.48% | 2.07% | 18.48% | 2 |
| M2 Money Stock (B) | 11,714.70 | 1.22% | 5.84% | 37.49% | 4 |
| Monetary Base (B) | 4,063.92 | 2.13% | 7.67% | 99.97% | 4 |
| Outstanding US Gov’t Debt (B) | 17,824,071 | 1.09% | 6.49% | 49.66% | 4 |
| Total Credit Market Debt (B) | 57,981.79 | 0.72% | 3.65% | 10.52% | 4 |
| Velocity of Money [M2] | 1.53 | -0.46% | -1.98% | -11.09% | 2 |
| US Trade Balance | -46,557.00 | -17.12% | 24.51% | -22.57% | 1 |
| Big Mac Index | Expensive | 1 | |||
| US Dollar | 94.97 | 4.78% | 16.71% | 19.29% | 1 |
| IAG Monetary Inflation Index* | Mild Deflation | 2 | |||
| Energy | |||||
| Electricity (cents / KW hour) | 12.46 | -0.95% | 3.06% | 3 | |
| Coal (CAPP) | 53.06 | -5.11% | -14.67% | -9.07% | 1 |
| Oil | 47.59 | -11.39% | -51.14% | -34.67% | 1 |
| Natural Gas | 2.66 | -8.45% | -45.49% | -49.23% | 1 |
| Gasoline | 1.47 | -0.47% | -45.12% | -23.00% | 1 |
| IAG Energy Inflation Index* | Strong Deflation | 1 | |||
| Food and Essentials | |||||
| Wheat | 503.00 | -14.75% | -9.41% | 5.95% | 2 |
| Corn | 370.75 | -6.67% | -14.67% | 4.07% | 1 |
| Soybeans | 961.25 | -6.04% | -25.12% | 5.03% | 1 |
| Orange Juice | 140.30 | 0.04% | -1.72% | 3.09% | 3 |
| Sugar | 14.79 | 1.44% | -5.19% | -50.54% | 2 |
| Pork | 67.65 | -16.56% | -21.59% | -1.10% | 1 |
| Cocoa | 2682.00 | -8.12% | -7.26% | -15.95% | 2 |
| Coffee | 161.90 | -3.80% | 28.95% | 22.65% | 5 |
| Cotton | 47.59 | -21.01% | -51.14% | -34.71% | 1 |
| Stamps | $0.49 | 0.00% | 6.52% | 11.36% | 4 |
| CRB Foodstuffs Index | 350.11 | -5.21% | 7.06% | 3.34% | 2 |
| IAG Food and Essentials Inflation Index* | Strong Deflation | 1 | |||
| Construction and Manufacturing | |||||
| Copper | 2.50 | -11.71% | -21.76% | -18.97% | 1 |
| Lumber | 322.50 | -2.66% | -9.49% | 26.13% | 2 |
| Aluminum | 0.82 | 1.53% | 7.50% | -11.57% | 3 |
| CRB Raw Industrials | 481.38 | -2.18% | -8.14% | 1.48% | 2 |
| Total Construction Spending (M) | 982,089.00 | 0.36% | 2.18% | 10.19% | 3 |
| IAG Construction & Manufacturing Index* | Mild Deflation | 2 | |||
| Precious Metals | |||||
| Gold | 1,283.00 | 8.43% | 3.00% | 18.59% | 2 |
| Silver | 17.23 | 9.78% | -10.03% | 6.52% | 4 |
| IAG Precious Metals Inflation Index* | Stable | 3 | |||
| Innovative Advisory Group Index | |||||
| IAG Inflation Index Composite* | mild deflation | 2 | |||
* If you would like a description of terms, calculations, or concepts, please visit our Inflation monitor page to get additional supporting information. We will continually add to this page to provide supporting information.
* Our Inflation Score is based on a proprietary algorithm, which is meant to describe the respective category by a simple number. The scores range from 1-5. One (1) being the most deflationary. Five (5) being the most inflationary. These scores are meant to simplify each item and allow someone to quickly scan each item or section to see the degree of which inflation or deflation is present.
* We have also added our own indexes to each category to make it even easier for readers to receive a summary of information.
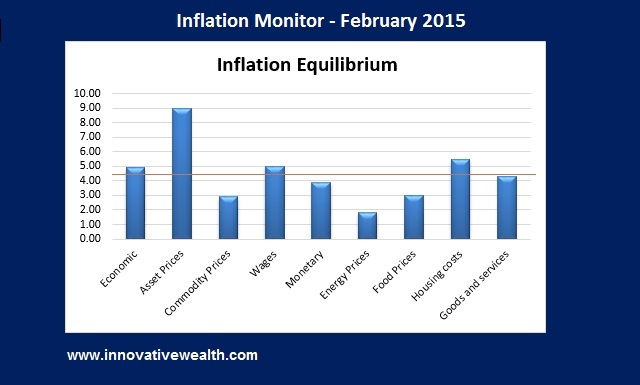
Inflation Deflation Composite Ranking
* The Inflation Equilibrium is a quick summary for the whole data series of the inflation monitor. If you don’t like statistics, this is the chart for you.
Inflation Monitor – February 2015 – Introduction
It is February and it is off to a good start with the New England Patriot winning the Super Bowl… Sorry NFL “the Big Game”. Even if you were not a fan, it was a great game to watch up until the last play. The win helped warm the city from the historic snow falls we have experienced and the cold chill of deflation setting in around the US and most of the world. It has been a few months since I have started the Inflation Monitor and each of those months has been marked with deflation. I have been saying for the past few years that deflation is in our future despite all the money printing by the Federal Reserve. It appears as if this has now become apparent to everyone else. Although there are many deflation deniers out there who think it cannot happen and won’t happen.
I just got back from the TD Ameritrade conference in San Diego. One of the keynote speakers was Craig Alexander, the Chief Economist at TD Bank. Normally he is one of my favorite speakers at the conference each year, however, this time I noticed something different. This keynote speech from Craig was focused on how deflation could not happen in the US. This was not just one small part of the speech. Most of the speech was about deflation. A bit odd considering the topic of deflation has just come into the public’s view from the media’s lens. Craig spent most of his time discussing inflation and how deflation would not affect the US. Normally I might have just dismissed this as just one person’s misguided opinion, but he made a very subtle mention of one thing in his speech. He said he just got back from meeting with some members of the FOMC.
This acknowledgment of the meeting plus the excessive denial about deflation leads me to believe that the Fed is VERY worried about deflation. This should be no surprise to you readers of the Inflation Monitor since we have seen this deflation data consistently since I started the Inflation Monitor. This leads me to my next question… Should I just rename this publication the Deflation Monitor?
While Inflation can be cranked up or dialed down relatively easily, deflation is not something that can easily be fought with monetary tools. We have seen a trend which is undoubtedly scary for the central banks with the existence of negative interest rates. Academics of the world might find this fascinating since we are in uncharted waters for the global economy, deflation and interest rates. I’m sure many years later economists will come up with an answer why deflation happened as it did. Economists are famous for coming up with an answer for why something happened after it happened rather than before. However, their answers are not always correct. Maybe that is why Thomas Carlyle called economics “the dismal science”.
In this month’s Inflation Monitor, I have some very interesting charts to share with you. One of the measures of inflation/deflation is the interest rate yield curve. I have a number of interest rate yield curve charts to share in this issue.
As always, please contact me to send your feedback on how I can make this monthly Inflation Monitor a better tool or resource for you. Thank you for reading and I hope you enjoy this month’s issue – Inflation Monitor – February 2015.
Kirk Chisholm
Charts of the Month
Here are some charts I found interesting in the past month.
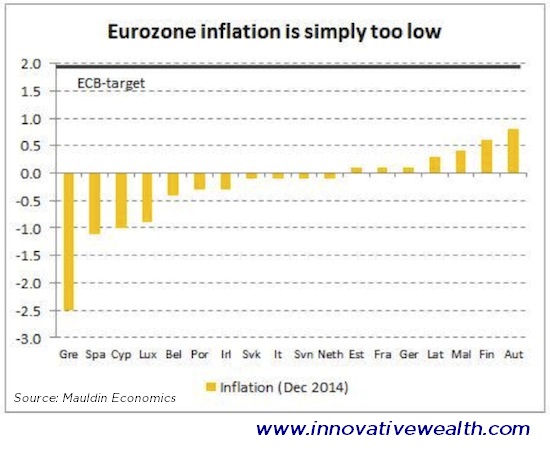
Euro Zone Inflation Target vs Actual
It should be clear from this that Europe is in a deflationary cycle. The ECB target is 2%, yet more than half the countries have negative inflation (deflation). Some countries are actually having some minor inflation, however, it is far below the target set by the ECB. None of the countries in the EU have even half of the 2% inflation target which the ECB has set,
European Bond Yield Curve (by country)
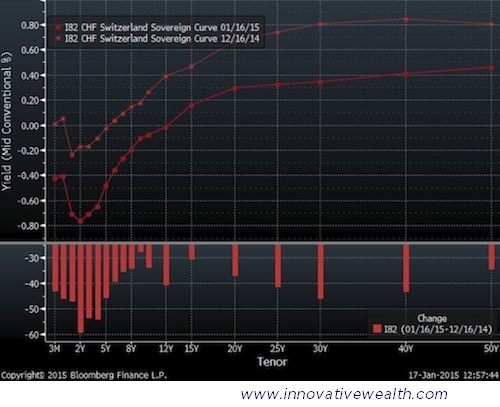
Switzerland Sovereign Bond Yield Curve
Apparently, people are really interested in buying Swiss bonds in order to lose money. If you want Swiss bonds, you will have to buy 12-year maturities or longer in order to make any positive interest. This is partially due to the Swiss un-pegging the Franc from the Euro, although it shouldn’t have been pegged in the first place.
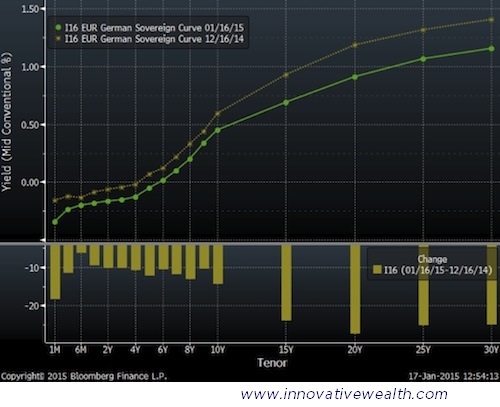
Germany Sovereign Bond Yield Curve
The German bond yield curve requires you to go out to 6-year maturities in order to get a positive yield on your bonds.
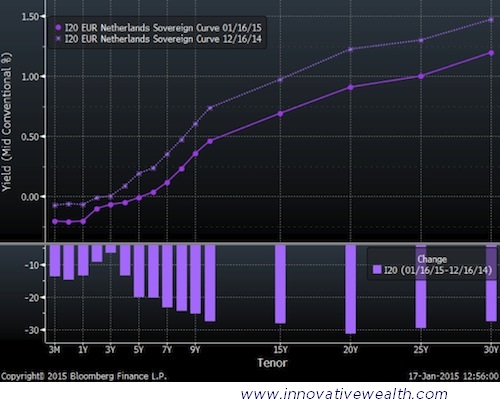
Netherlands Sovereign Bond Yield Curve
The Netherlands bond yield curve requires you to go out to 6-year maturities in order to get a positive yield on your bonds.
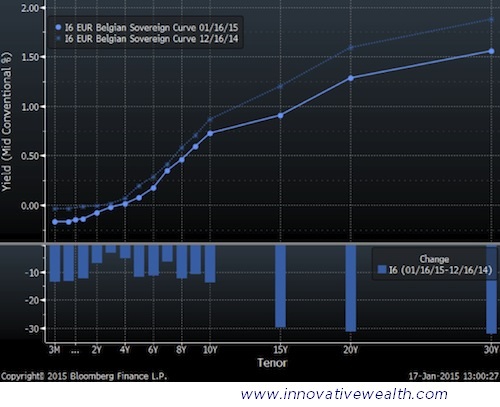
Belgium Sovereign Bond Yield Curve
The Belgian bond yield curve requires you to go out to 4-year maturities in order to get a positive yield on your bonds. Belgium also has 101% debt to GDP.
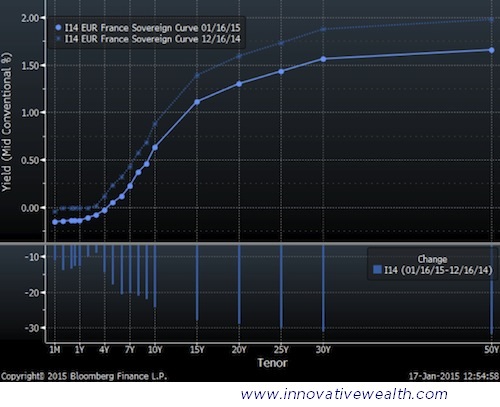
France Sovereign Bond Yield Curve
The France bond yield curve requires you to go out to a little over 4-year maturities in order to get a positive yield on your bonds.
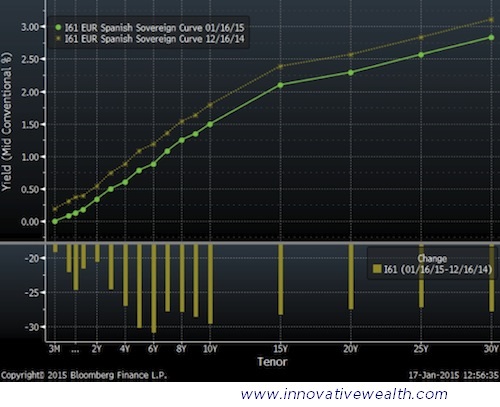
Spain Sovereign Bond Yield Curve
The Spain bond yield has a positive yield for your bonds anywhere on the curve. However, this is primarily due to an increased risk in Spain’s economic situation.
Portugal Sovereign Bond Yield Curve
The Portuguese bond yield is also positive on the entire yield curve. Just like Spain, Portuguese bonds have a positive yield due primarily to an increased risk in Portugal’s economic situation.
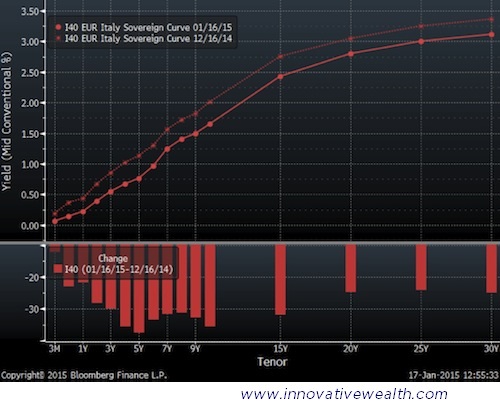
Italy Sovereign Bond Yield Curve
The Italian bond yield is positive all along the yield curve. Italy, as you will see in the next section is having a problem with their GDP declining since 2008. Their debt to GDP is 133% with a 4-5% growth rate in debt. A declining GDP with an increasing debt load is not a sustainable situation.
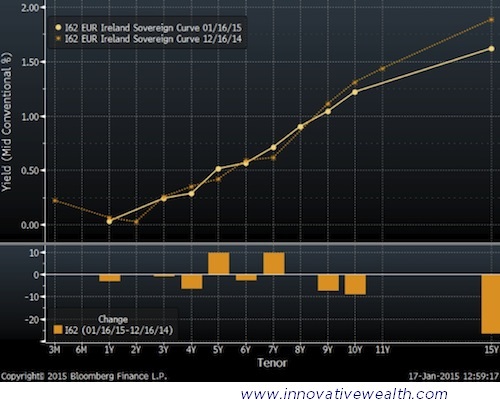
Ireland Sovereign Bond Yield Curve
The Ireland bond yield is positive all along the yield curve. However, their debt to GDP is at 125%
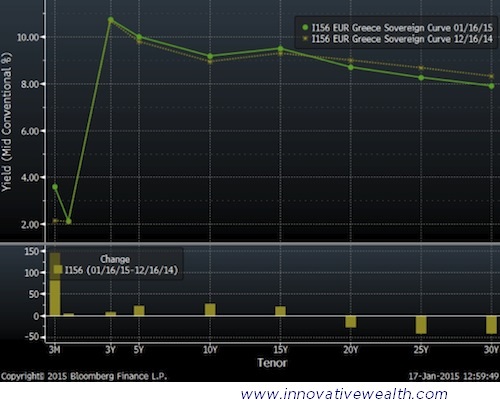
Greece Sovereign Bond Yield Curve
The Greece bond yield curve is positive all along the yield curve. I hope you are aware of the problems in Greece since it would take a long time to discuss them all here. They are in the headlines every day, so it shouldn’t be hard to find. Despite the issues in Greece being swept under the rug in 2011, they were not solved. Just pushed back a few years until the end of February. While 10% might seem like a nice yield, the risk are high that further devaluation could occur in the next 3 years.
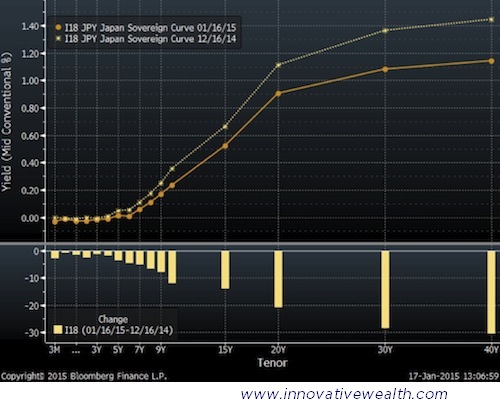
Japan Sovereign Bond Yield Curve
Japan’s Bond Yield Curve has been flattening for quite some time now. I expect that this trend will continue. Getting 0.9% for 20 years really hurts when you are trying to get income for retirement.
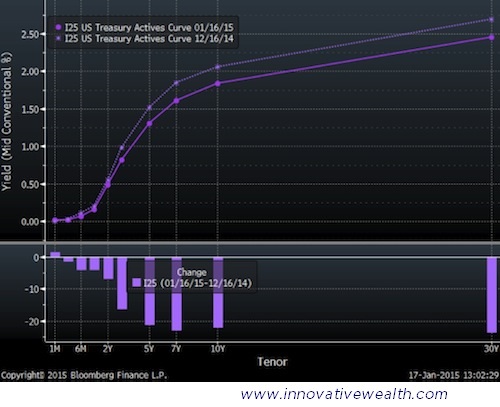
US Treasury Bond Yield Curve
The US Bond Yield Curve is a bit more reasonable. What is a bit surprising to me is that the US is an economic oasis in a sea of deflation. I doubt this will last longer than 2-3 quarters since many of the US companies have a significant portion of their revenues from international markets. However until then, a yield just under 1.7% for 10 years is quite nice compared to the other yield curves on this list.
US GDP vs Japan GDP vs Italy GDP
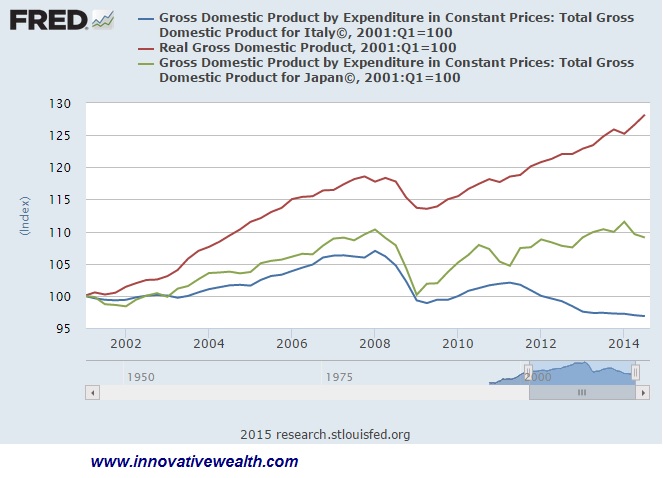
This chart should be self-explanatory. The US is the place to be… Italy is not.
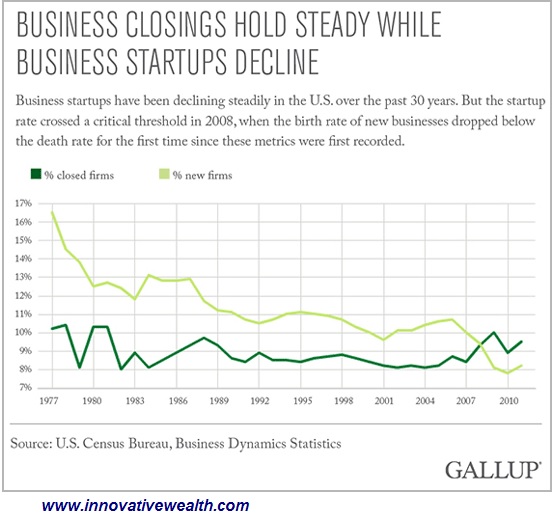
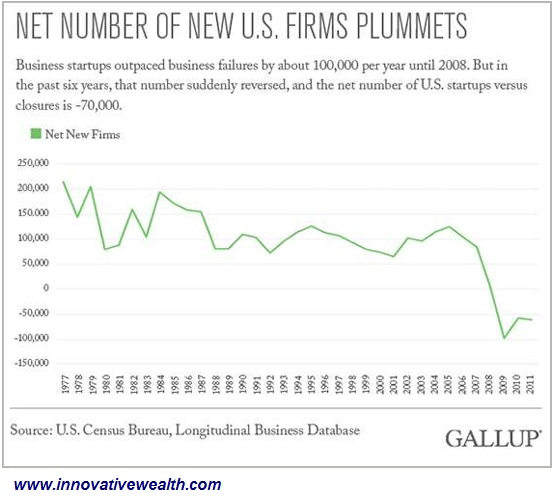
Small to Mid-sized Businesses – The Fuel That Runs the US economy.
The US economy depends on small to mid-sized businesses to grow. If they are not being started or grown, then that is not optimistic for the US economy long term. While the stock market and the economy are doing well at the moment, if the US wants sustainable growth that doesn’t involve printing money, they will need to have small to mid-sized business growth.
I guess the “wealth effect” produced by the US stock markets, which have risen for the past 5 years, does not permeate into the small business world. I have a novel idea. Instead of passing out tax credits, free government money, and special favors to big businesses, maybe they should focus more on the drivers of the US economy. It would certainly make our economy recovery more sustainable. Maybe the first step would be to provide incentives to the banks to lend to small businesses. From what I have been hearing, banks are very stingy on lending and have been since 2008. I don’t think Operation Chokepoint (which was stopped at the end of January) has helped much either.
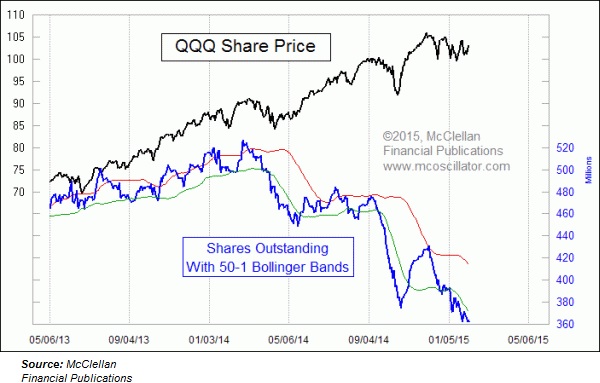
ETF Shares Outstanding
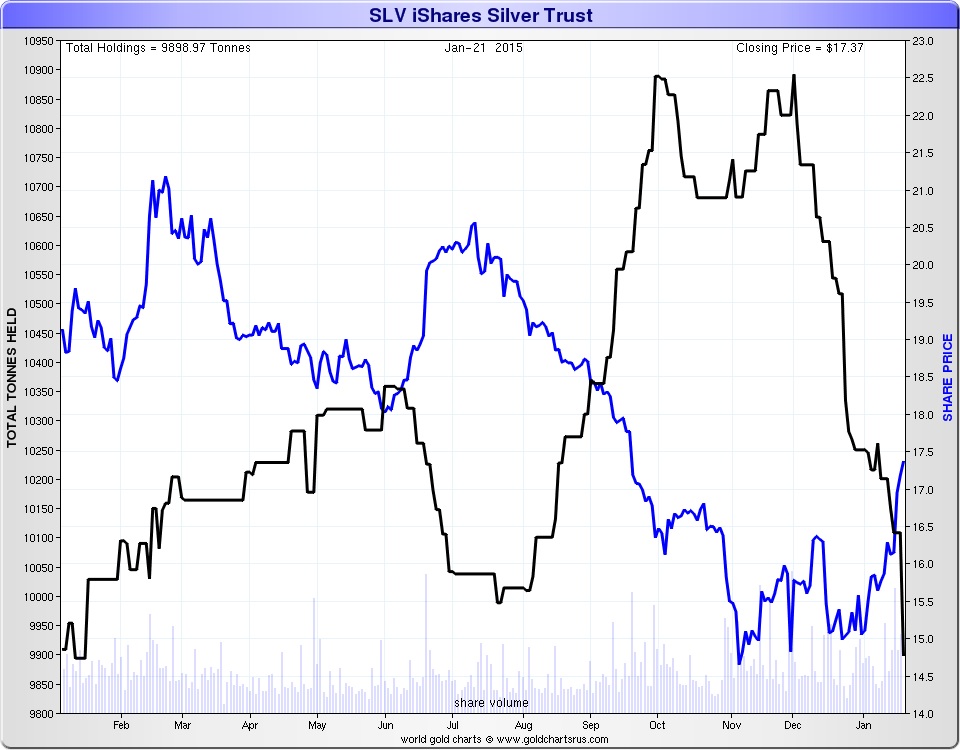
Silver (SLV)
The ETF SLV which is an ETF holding primarily physical silver. This is interesting if you follow the actual holdings
Nasdaq (QQQ)
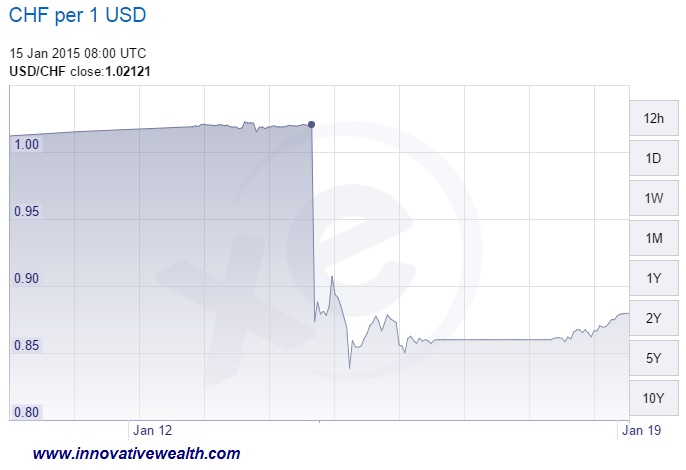
The Swiss Franc drops the Euro peg
The Swiss franc pegged itself to the Euro back in August 2011. This was primarily due to the Franc becoming too expensive compared to the Euro. This put Swiss exporters at a disadvantage, so they decided to peg the Franc to the Euro at a ratio of 1.2:1. This lasted until recently on January 15th the Swiss Central Bank decided to un-peg the Franc from the Euro and it resulted in a quick 18% drop. Their response was that it was getting too expensive to hold the peg. I can’t blame them, its hard to tie yourself to countries like Greece and expect positive results.
I hope you enjoyed this month’s inflation monitor. See you next month.
Cheers,
Kirk Chisholm
The IAG Inflation Monitor – Subscription Service
We are initially publishing this Inflation Monitor as a free service to anyone who wishes to read it. We do not always expect this to be the case. Due to the high demand for us to publish this service, we plan to offer it free for a while and when we feel we have fine tuned it enough, we do plan on charging for access. Our commitment to our wealth management clients is to always provide complimentary access to our research. If you would like to discuss becoming a wealth management client, feel free to contact us.
Sources:
- Federal Reserve – St. Louis
- U.S. Energy Information Administration
- U.S. Post Office
- National Association of Realtors
- The Economist
- The Commodity Research Bureau
- Gurufocus.com
- stockcharts.com
- Bloomberg
* IAG index calculations are based on publicly available information.
** IAG Price Composite indexes are based on publicly available information.
About Innovative Advisory Group: Innovative Advisory Group, LLC (IAG), an independent Registered Investment Advisory Firm, is bringing innovation to the wealth management industry by combining both traditional and alternative investments. IAG is unique in that we have an extensive understanding of the regulatory and financial considerations involved with self-directed IRAs and other retirement accounts. IAG advises clients on traditional investments, such as stocks, bonds, and mutual funds, as well as advising clients on alternative investments. IAG has a value-oriented approach to investing, which integrates specialized investment experience with extensive resources.
For more information, you can visit www.innovativewealth.com
About the author: Kirk Chisholm is a Wealth Manager and Principal at Innovative Advisory Group. His roles at IAG are co-chair of the Investment Committee and Head of the Traditional Investment Risk Management Group. His background and areas of focus are portfolio management and investment analysis in both the traditional and non-traditional investment markets. He received a BA degree in Economics from Trinity College in Hartford, CT.
Disclaimer: This article is intended solely for informational purposes only, and in no manner intended to solicit any product or service. The opinions in this article are exclusively of the author(s) and may or may not reflect all those who are employed, either directly or indirectly or affiliated with Innovative Advisory Group, LLC.

